
Last Updated on 2nd June 2025 by peppe8o
This tutorial will show you how to create a cool Raspberry PI Pico Weather Display with an e-Paper (e-Ink) monitor showing the weather status and forecasts.
Please note that I’ve already covered, with a detailed tutorial, how to use an e-paper display with Raspberry PI Pico. You can refer to that post if you want to know more about customizing your e-paper display layout.
For this project, our Raspberry PI Pico isn’t going to measure the sun/rain status, but we’ll use a free online weather service to get both current values and forecasts for the following days.
The Weather Service: Open-Meteo
Open-Meteo is an online weather provider that enables you to get information about the current weather and the forecasts for any location. The data exchange can be achieved through their API, which doesn’t require authentication with any API Key. So, you don’t need to register on their website in order to get their data, unless you need it for commercial use.
Open-Meteo also gives paid plans for commercial use, you can check their pricing plans if required.
With Open-meteo, you can just send a web query to their web services, extract the resulting response (a JSON) and parse it to get your data.
This tutorial will show you a simple usage of their API query, you can customise it with more details by looking at their API Docs.
What We Need
As usual, I suggest adding from now to your favourite e-commerce shopping cart all the needed hardware, so that at the end you will be able to evaluate overall costs and decide if to continue with the project or remove them from the shopping cart. So, hardware will be only:
- A common computer (maybe with Windows, Linux or Mac). It can also be a Raspberry PI Computer board
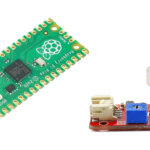
- Raspberry PI Pico W microcontroller (with a common micro USB cable). Please note that you will need a “W” model of Raspberry PI Pico, as this allows you to connect to the internet to get API responses
- dupont wirings
- e-paper module (the mine is from the SunFounder shop)
This tutorial will show you the project without a case. Of course, you can customise your own case and display layout. If you wish to send me pictures of your results, I will be really happy to publish them in this post. Please send them to giuseppe@peppe8o.com, with the pictures at least 1000 pixels in width.
Step-by-Step Procedure
Prepare the Wiring
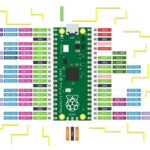
Please arrange the wiring according to the Raspberry PI Pico Pinout, as in the following picture:
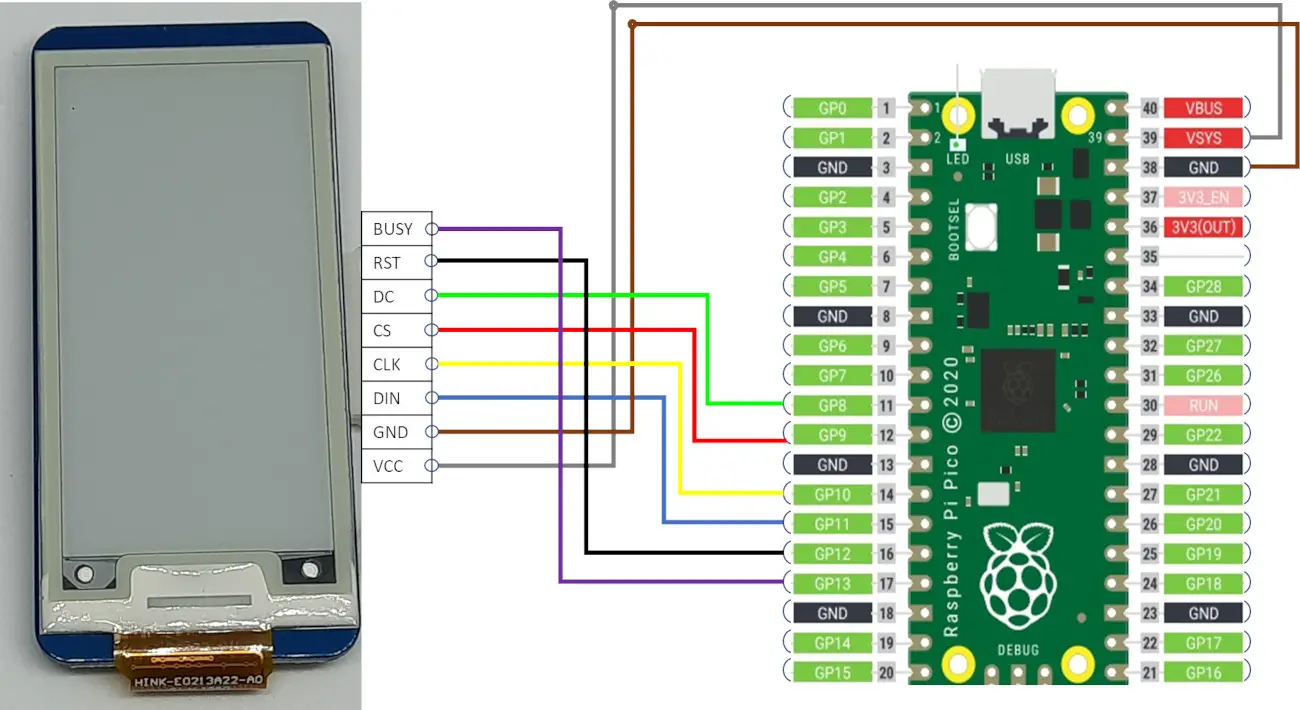
The wiring matches that used in my Raspberry PI Pico and e-paper (e-ink) Display tutorial, where you can also find pictures.
Install MicroPython on Raspberry PI Pico
Connect RPI Pico to Thonny. For the very first steps of installing MicroPython, you can refer to my tutorial about the first steps with Raspberry PI Pico.
Prepare the Weather Icons
The OpenWeather API can return us a limited number of weather conditions according to their Weather-Condition-Codes-2. In the “Main” column of their tables, you can find all the answers that we can grab with the API requests. We’ll use these names for our weather icons so that getting an answer like “Rain” will be directly addressed to our icon that will be named “Rain.pbm”.
So, we must create and save in our Raspberry PI Pico all the required icons for the following possible answers:
- Clear
- Clouds
- Fog
- Drizzle
- Rain
- Snow
- Squall
- Thunderstorm
Moreover, I suggest adding an “Undefined” icon, so that you can see if new values have been added to their weather description without getting your Raspberry PI Pico in error.
It is important to note that we must create the icons as “pbm” files and the procedure to create them with the open-source GIMP is available in my Raspberry PI Pico and e-paper (e-ink) Display tutorial. Also, note that you should create all of them with the same sizes, to fit your display layout and keep the same display space even when weather conditions change.
I’ve prepared a set of icons to make it possible for you to directly implement the code in your Raspberry PI Pico Weather Monitor. You can get the zip file including all the icons with the following download:
Once downloaded, please extract the files from the zip and upload the PBM files to your Raspberry PI Pico storage, in the root folder.
Get MicroPython Libraries and Code
Please, also download the following libraries and upload them into your Raspberry PI Pico root folder:
- pico_epaper-2.13.py (can vary if you have a different e-paper display, please refer WaveShare GitHub page for their products). Please note that you must rename it to “pico_epaper.py” before uploading it to your Raspberry PI Pico.
We also need the main code that will run our Raspberry PI Pico Weather Monitor:
Upload these files to your Raspberry PI Pico storage.
Please also remember to rename the “pico-weather.py” to “main.py” if you want it to run automatically when plugging the power supply into the Raspberry PI Pico without a computer. You must also set this script with some custom variables as explained in the following section.
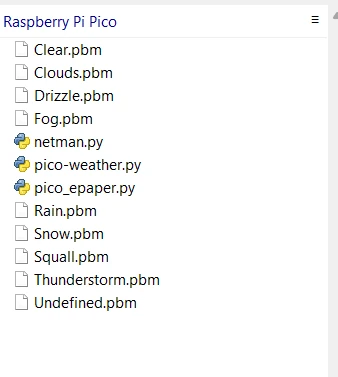
At the end, your Raspberry PI Pico W storage will include the following files:
The pico-weather.py code
Let’s analyse the main code that performs the Weather Monitor job.
In the beginning, we include the libraries to get the network connection and the weather information:
import netman
import urequests, json
The following lines must be edited with your country ID and home WiFi. The first identifies the 2-letter country code, while the SSID and password depend on your home WiFi settings:
country = 'IT'
ssid = 'your_WiFi_Name'
password = 'your_WiFi_Password'
After this, the Raspberry PI Pico will try to connect:
wifi_connection = netman.connectWiFi(ssid,password,country)Now, the Open-Meteo configuration comes. You should change your localisation latitude and longitude (lat and long are available also from https://www.latlong.net). It needs also your timezone:
lat="41.9661" #change it with your Home latitude
lon="12.66" #change it with your Home longitude
timezone="Europe/Rome" #change it with your timezone
The code also uses a dictionary, named “weather_code_descr”. It will allow you to convert the weather codes coming from Open-Meteo into description strings. It is important to note that the strings MUST match the icon names:
weather_code_descr={0:"Clear",\
1:"Clear",\
2:"Clouds",\
3:"Clouds",\
45:"Fog",\
48:"Fog",\
51:"Drizzle",\
53:"Drizzle",\
55:"Drizzle",\
56:"Drizzle",\
57:"Drizzle",\
61:"Rain",\
63:"Rain",\
65:"Rain",\
66:"Rain",\
67:"Rain",\
71:"Snow",\
73:"Snow",\
75:"Snow",\
77:"Snow",\
80:"Squall",\
81:"Squall",\
82:"Squall",\
85:"Snow",\
86:"Snow",\
95:"Thunderstorm",\
96:"Thunderstorm",\
99:"Thunderstorm",\
100:"Undefined"}
Then the code sets the Open-Meteo API string according to what is configured with the variables. You don’t need to change anything here
url_call="https://api.open-meteo.com/v1/forecast?latitude="+lat+\
        "&longitude="+lon+\
        "&daily=weather_code,temperature_2m_max,temperature_2m_min,precipitation_sum&"+\
        "timezone="+timezone.replace("/","%2F")
Now, we send the request to the Open-Meteo service, converting the response into a JSON string, named “forecast”, and then closing the request session. The print() statements will print into your Thonny shell some debugging info which can be useful in case of issues with the code:
w=urequests.get(url_call)
forecast=json.loads(w.content)
print("Received the following response:")
print(forecast)
print()
w.close()
We now have the weather data, so we can proceed with the e-paper display setup and update. The following rows will include the required libraries for the e-paper display:
from pico_epaper import EPD_2in13
import framebuf, time
Then, we’ll define a custom function that will help us make the code simpler. This custom function, pbm_draw(), has already been explained in my tutorial on the e-paper display usage:
def pbm_draw(x_pos,y_pos,file):
    with open(file, 'rb') as f:
        f.readline() # The first 2 lines of PBM files are info not related to the image
        f.readline() # the 2 readlines remove these lines
        size = f.readline().decode('utf-8') # The 3rd row includes a byte with picture sizes that is decoded
        (x,y)=size.split("\n")[0].split(" ") # X variable gets the width, y variable gets the height
        data = bytearray(f.read())
    fbuf = framebuf.FrameBuffer(data, int(x), int(y), framebuf.MONO_HLSB)
    epd.blit(fbuf, x_pos, y_pos, white)
In the following lines, we initialise the e-paper display. Please note again that the epd definition could change according to your e-paper display:
epd = EPD_2in13()
black=0x00
white=0xff
epd.fill(white)
epd.display(epd.buffer)
The following lines will scrape the Open-Meteo response to get the current (today) values for minimum and maximum temperature, rain quantity, and weather description. It is important that if the weather_code returned from the API isn’t included in our weather_code_descr dictionary, we’ll change it the the default “100” value which matches the “undefined” description and will print an icon with a ? (question mark).
We associate these values with the related variables to use them in the next lines:
temp_min=float(forecast["daily"]["temperature_2m_min"][0])
temp_max=float(forecast["daily"]["temperature_2m_max"][0])
rain_qty=int(forecast["daily"]["precipitation_sum"][0])
weather_code=forecast["daily"]["weather_code"][0]
if weather_code not in weather_code_descr: weather_code = 100
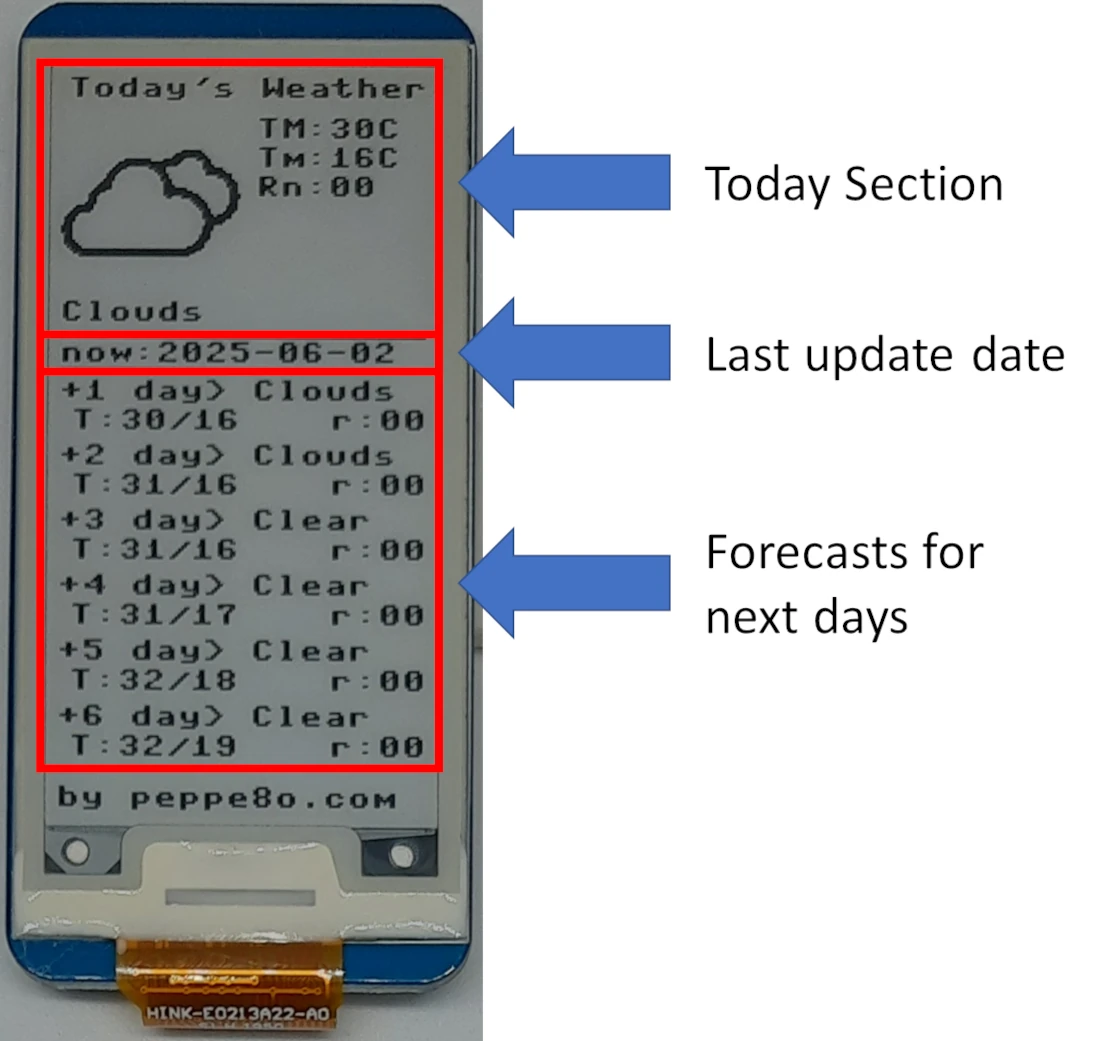
weather_descr=weather_code_descr[weather_code]The first display block will show the forecasts for today and the related icon:
epd.text("Today's Weather", 2, 1, black)
pbm_draw(0, 15,weather_descr+'.pbm')
epd.text("TM:{:.0f}".format(temp_max)+"C", 65, 15, black)
epd.text("Tm:{:.0f}".format(temp_min)+"C", 65, 25, black)
epd.text("Rn:{:02d}".format(rain_qty), 65, 35, black)
epd.text(weather_descr, 0, 78, black)
The second block will show the current date. This block is visually separated from the previous and the following with 2 horizontal lines and this can be useful to check that the script is running (if the date printed here is different from your date, this means that something went wrong):
epd.hline(0, 90, 125, black)
today_date = forecast["daily"]["time"][0]
epd.text("now:"+today_date, 0, 92, black)
epd.hline(0, 101, 125, black)
The next code block will get the forecasts for the next 6 days. It uses a for loop, where the same values are extracted from the Open-Meteo response and printed into 2 lines (as we’ll see in the following chapter):
start_line=105

for day in range(0,6):
    d=day+1
    temp_min=float(forecast["daily"]["temperature_2m_min"][d])
    temp_max=float(forecast["daily"]["temperature_2m_max"][d])
    rain_qty=int(forecast["daily"]["precipitation_sum"][d])
    weather_code=forecast["daily"]["weather_code"][d]
    weather_descr=weather_descr=weather_code_descr[weather_code]
    line = start_line + 2 * day * 11
    epd.text("+"+str(d)+" day> "+weather_descr, 0, line, black)
    epd.text("T:{:.0f}/{:.0f}".format(temp_max,temp_min), 4, line+10, black)
    epd.text("r:{:02d}".format(rain_qty), 90, line+10, black)
A final text line shows a very small banner with a reference to this blog (peppe8o.com). You can customise it too, according to your preferences (or leave it to remember where the project comes from 🙂 )
epd.text("by peppe8o.com", 0, 242, black)
epd.display(epd.buffer)
The display paging is finished. We can send it to sleep, as the e-paper technology can keep the shown information even in sleep mode and even without a power supply:
epd.sleep()A 10-second time sleep is kept here, to make it possible for you to send an interrupt (if required, for debugging) before sending the Raspberry PI Pico to a deep sleep mode:
time.sleep(10)Finally, we use the machine.deepsleep() function to send the Pico on standby for a defined “sleep_time” (in milliseconds). This will allow us to reduce the required current, as proved in my Raspberry PI Pico W Power Consumption (mA) and How to Reduce It tutorial. You can just set the number of minutes to your preferred:
sleep_minutes=15
sleep_time=sleep_minutes * 60 * 1000
machine.deepsleep(sleep_time)
Testing the Raspberry PI Pico Weather Monitor
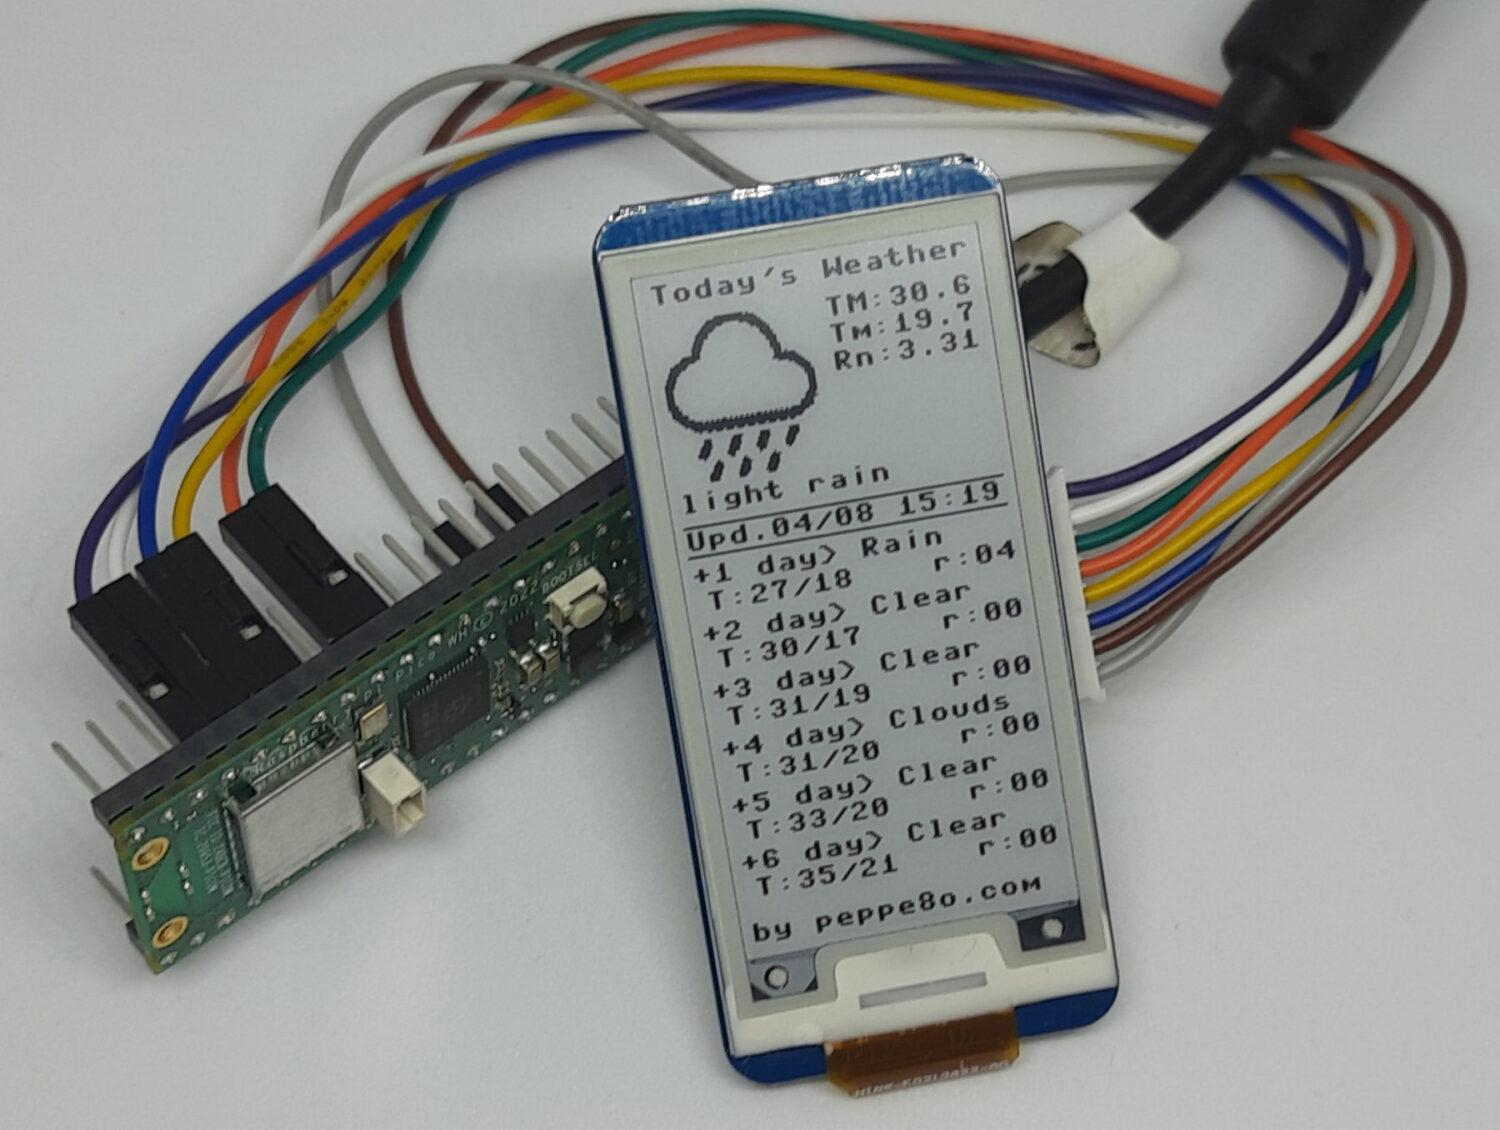
The following picture shows the final result. It shows the “today” section, the “now” date (which shows you when the last update was performed), and, finally, the forecasts for the following days, where each day has temperatures (max/min) and rain quantity:
What’s Next
Interested in doing more with your Raspberry PI Pico? Try to look at my Raspberry PI Pico tutorials for useful and funny projects!
Enjoy!

Open source and Raspberry PI lover, writes tutorials for beginners since 2019. He's an ICT expert, with a strong experience in supporting medium to big companies and public administrations to manage their ICT infrastructures. He's supporting the Italian public administration in digital transformation projects.
![]()
![]()
![]()
![]()
![]()
![]()
![]()

I like this one a lot and it worked out quite well, but at the end I found it quite expensive in total compared tot he pimoronie badger W solution which is an e-ink display with a pico W as a unit which you can use as a badge on a makerfair or for whatever project else. This pimoroni badger came with a whole set of aplications from weather to whatever you want to pull from the web like how full the EU gas storages are in total.
I had paid 29€ free delivery for the badger, a compact solution and yours is using a 25$ e-ink of simliar size incl. shipping, but I had to pay 19% VAT afterwards (which could be OK, but also the dhl handling fee for paying the duties in advanced which was another 7€, so 12€ on to and 37€ in total, which I found a lot just for the e-ink display and I had not expected.
I had used your link to the fun shop, not amazon. Just to let you know that the pimoroni badger solution might be worth a look cause they offer also the librarys and support.
thanks and happy new year – arrived a few minutes ago and wanted to let you know about our chrismas results.
I keep getting a KeyError from the following lines:
temp_min=str(forecast[“daily”][0][“temp”][“min”])
temp_max=str(forecast[“daily”][0][“temp”][“max”])
rain_qty=str(forecast[“daily”][0][“rain”])
weather_main=forecast[“daily”][0][“weather”][0][“main”]
weather_descr=forecast[“daily”][0][“weather”][0][“description”]
The actual error is:
Traceback (most recent call last):
File “”, line 66, in
KeyError: daily
Any suggestions?
Hi Ryan,
An error there means that probably the forecast value returned from this line:
forecast=json.loads(w.content)Is empty or has an error. When you run the script from Thonny and get the error, you should be able to type “forecast” in your Thonny shell and see the variables content. I suspect that there’s something going wrong in your API call (maybe problems with the API token?)
It might help if I saved my file after pasting in my API key 😅
🤣
So! I ran into another KeyError on rain from the daily forecast. If there is no rain, the API does not return the rain value. I had to do
try:
rain_qty=str(forecast[“daily”][0][“rain”])
except KeyError:
rain_qty=”0″
I don’t know if this is the best solution, but I feel a little impressed with myself since I know very, very little about programming but I was able to get it to work 😀
I’m really happy that you learned to make this not easy project and how to debug these errors with the help of my blog. This is why I keep going on: having people new or quite new to microelectronics and programming able to build their projects. Thank you for your feedback about the error, I’ll try to manage this exception also in my code
https://api.openweathermap.org/data/2.5/onecall?lat="+lat+\"&lon="+lon+\
"&exclude="+exclude+\
"&units="+units+\
"&appid="+api_key
Who is in actually API …”/onecall…”. Its good? My English is bad…
Hi Tom,
this part in my script doesn’t need to be manually changed, as it uses the official API call URL from OpenWeather. This URL gets the correct values (longitude, exclude, units, and API Key) from the variables set at earlier stage in the script.
Please let me know if I didn’t understand correctly your question
The One Call API 2.5 has been deprecated on June 2024, new is One Call API 3.0. Your script doesnt work.
Ok, thanks. Found that the new 3.0 API call should work with a small change in the code, by changing my “pico-weather.py” script at this line:
url_call="https://api.openweathermap.org/data/2.5/onecall?lat="+lat+\with this:
url_call="https://api.openweathermap.org/data/3.0/onecall?lat="+lat+\To make it work, after signin in you probably need to subscribe the One Call API 3.0 from https://openweathermap.org/api.
So, they assure that the first 1000 API calls are for free, but you need anyway to put your credit card in the subscription. They also allow you to set this limit in the “Billing plan” tab in your Personal account.
Now, I usually don’t want to force my readers to use credit card for any of the projects i show them, so I will evaluate to find an alternative. But you are free to proceed with OpenWeather in this way (please let me know, also for feedback)
Hello, it’s work nice, but there is a hack . When it goes to deep sleep it never wake up.
The time interval is set for 5 min but even after 20 min its not wake up. Is i missing something ?
In wemos D1 it’s works fine but in Raspberry Pi Pico W with RP2040 not.
Thanks for any clue.
Hi Simon. I will try to re-assemble the project again in these days and let you know. It’s really strange
…in the meanwhile, please can you try to add the following 2 lines at the begin of the pico-weather.py script and let me know if this fixes?
import machineif machine.reset_cause() == machine.DEEPSLEEP_RESET: machine.reset()