Last Updated on 21st May 2023 by peppe8o
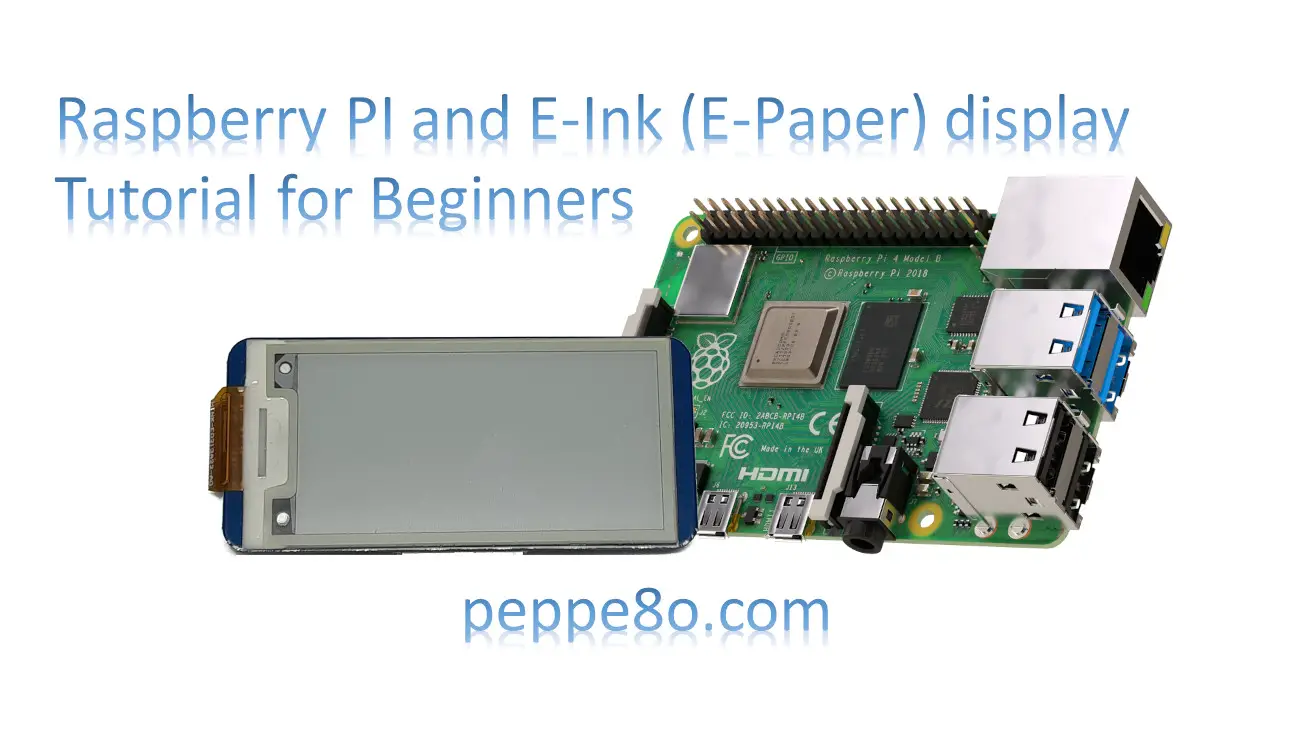
In this tutorial, I’m going to show you how to connect and use Raspberry PI with e-ink display, for Raspberry PI computer boards.
I’m not going to explain how the e-ink display physically works as I’ve done in the tutorial to use e-ink display with Raspberry PI Pico. I recommend you to look at the beginning of that article if you are interested in knowing the basics of this technology.
The great advantage of using e-ink displays (also sold as e-paper displays) is their very very low power consumption. These displays can show the last image or text even if disconnected from the power source, so they are really great for IoT solutions with limited access to power. Moreover, they also allow a better reading in different light conditions compared to the use of OLED displays.
For this tutorial, I will also add an extra, with a Python script showing you how to easily manipulate a jpg image and show it in your e-ink display.
For the following I’ve used a Raspberry PI 3 model A+, but you can use the same steps with any Raspberry PI computer board.
What We Need
As usual, I suggest adding from now to your favourite e-commerce shopping cart all the needed hardware, so that at the end you will be able to evaluate overall costs and decide if to continue with the project or remove them from the shopping cart. So, hardware will be only:
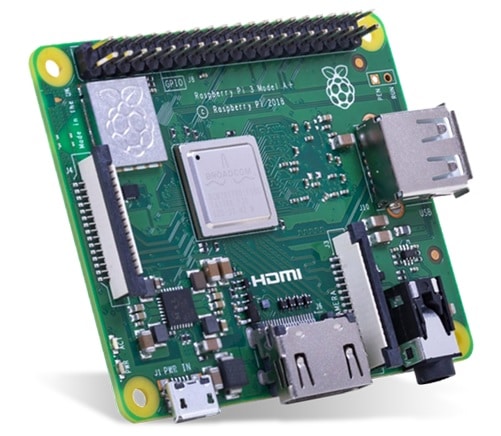
- Raspberry PI 3 Model A+ (including proper power supply or using a smartphone micro USB charger with at least 3A) or newer Raspberry PI Board
- high speed micro SD card (at least 16 GB, at least class 10)
- e-paper module (the mine is from SunFounder shop)
Step-by-Step Procedure
Prepare the Wiring between Raspberry PI and E-Ink Display
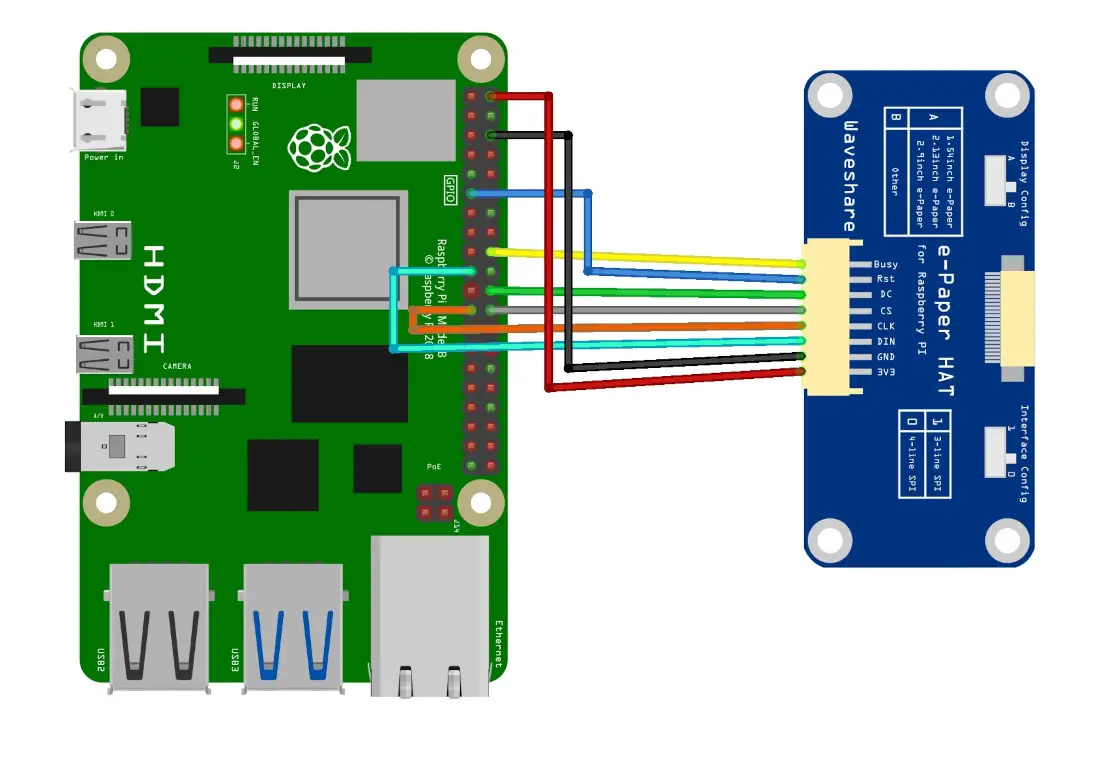
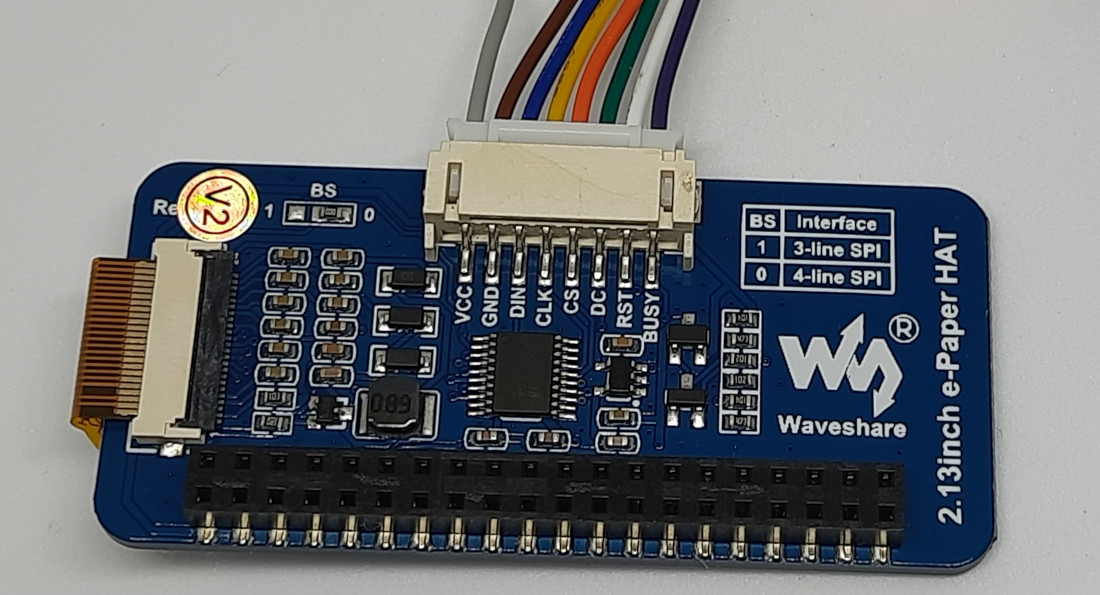
If you have the Waveshare e-Paper HAT, you can just plug it on your Raspberry PI GPIO heading. If you need some of the PINs, you can also use the 8-wires cable according to the following table and wiring diagram:
| e-Paper display | Raspberry PI |
|---|---|
| VCC | 5V (or 3.3V) |
| GND | GND |
| DIN | 19 (MOSI) |
| CLK | 23 (SCLK) |
| CS | 24 (CE0) |
| DC | 22 |
| RST | 11 |
| BUSY | 18 |
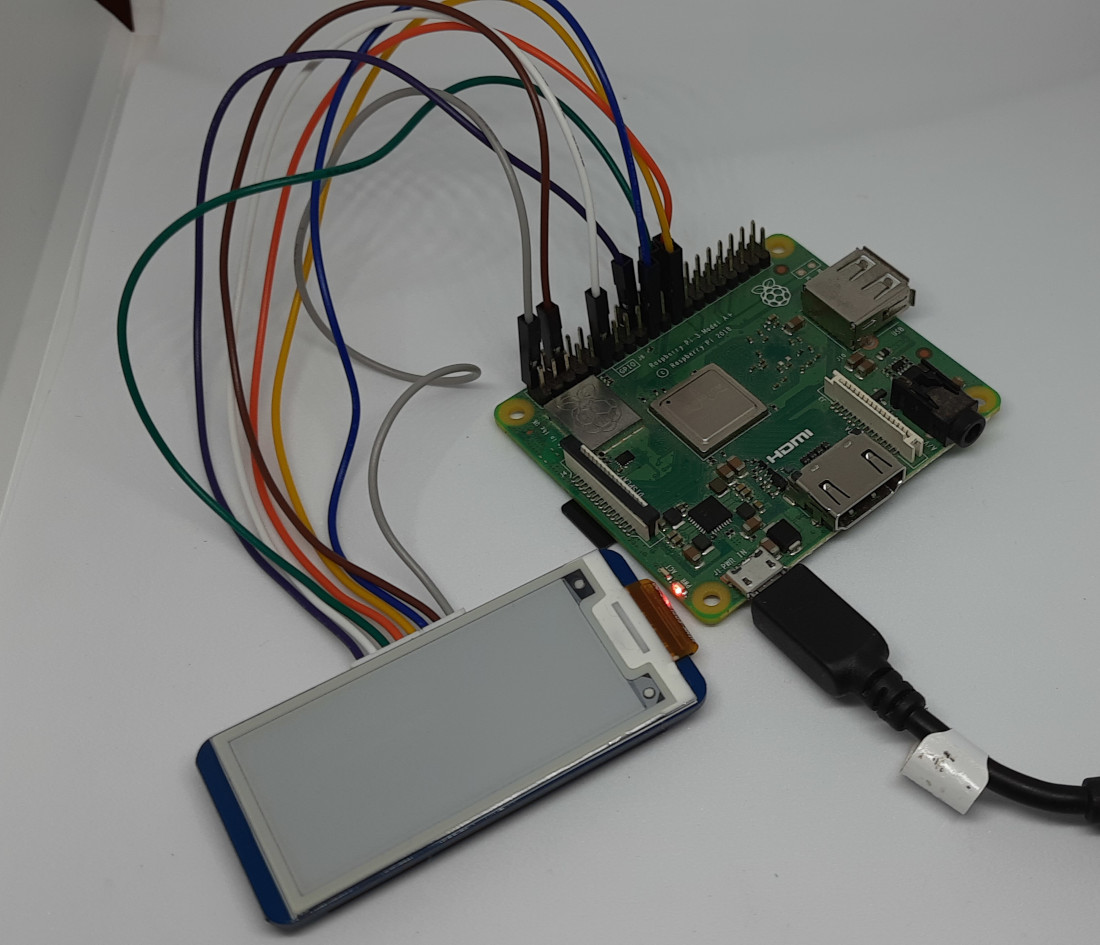
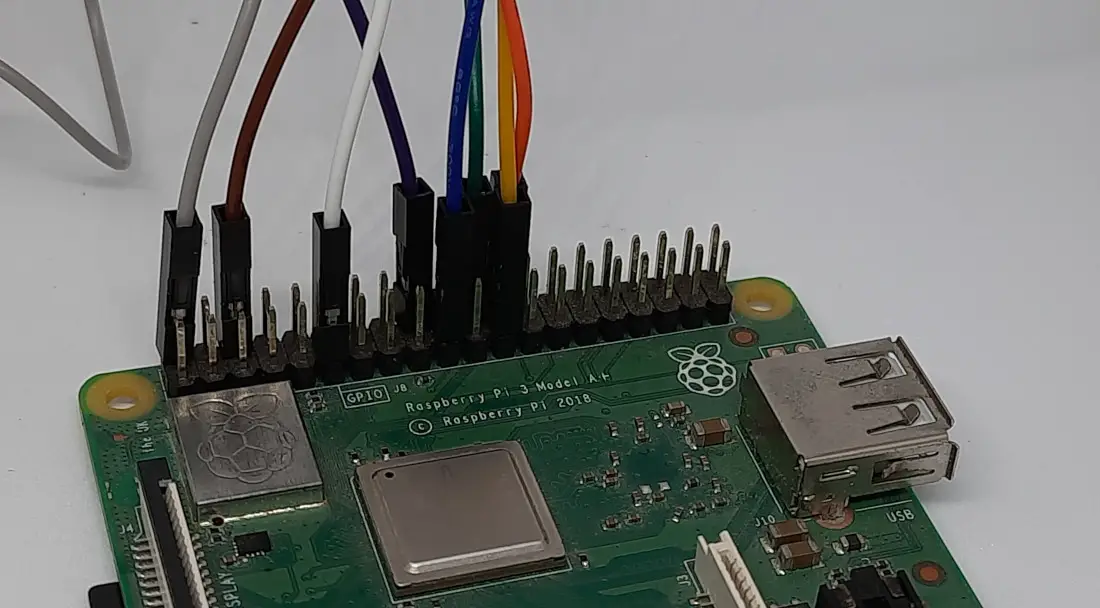
Please find below some pictures of my e-ink with Raspberry PI 3 Model A+:
Prepare the Raspberry PI Operating System
Please start installing your favourite OS. You can use Raspberry PI OS Lite (for a fast, headless operating system) or Raspberry PI OS Desktop (in this case working from its internal terminal).
Make your OS updated. From the terminal, use the following command:
sudo apt update -y && sudo apt upgrade -yYou need also to install some required packages. From terminal:
sudo apt install git python3-pip python3-pil python3-numpy python3-spidev -yDifferently from the Waveshare help page, you don’t need to install RPi.GPIO as it comes pre-installed in Raspberry PI OS.
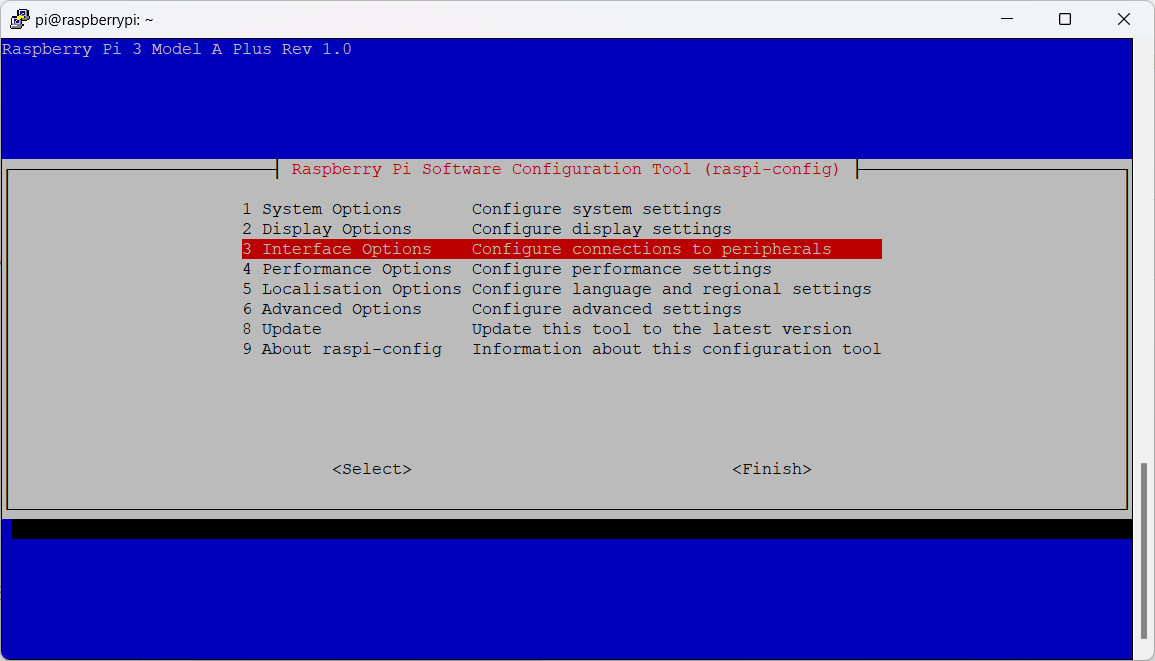
We also need to enable the SPI interface. From terminal:
sudo raspi-configThe terminal GUI will show you the classic options that you can configure from the raspi-config tool. Go to interface:
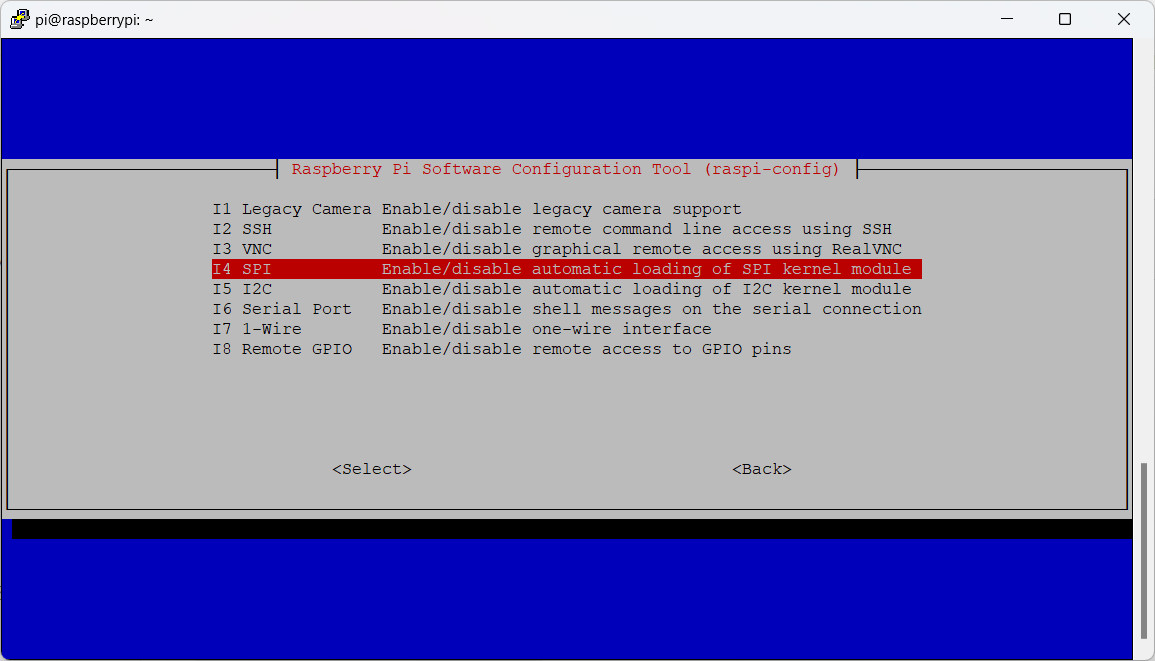
Then select SPI:
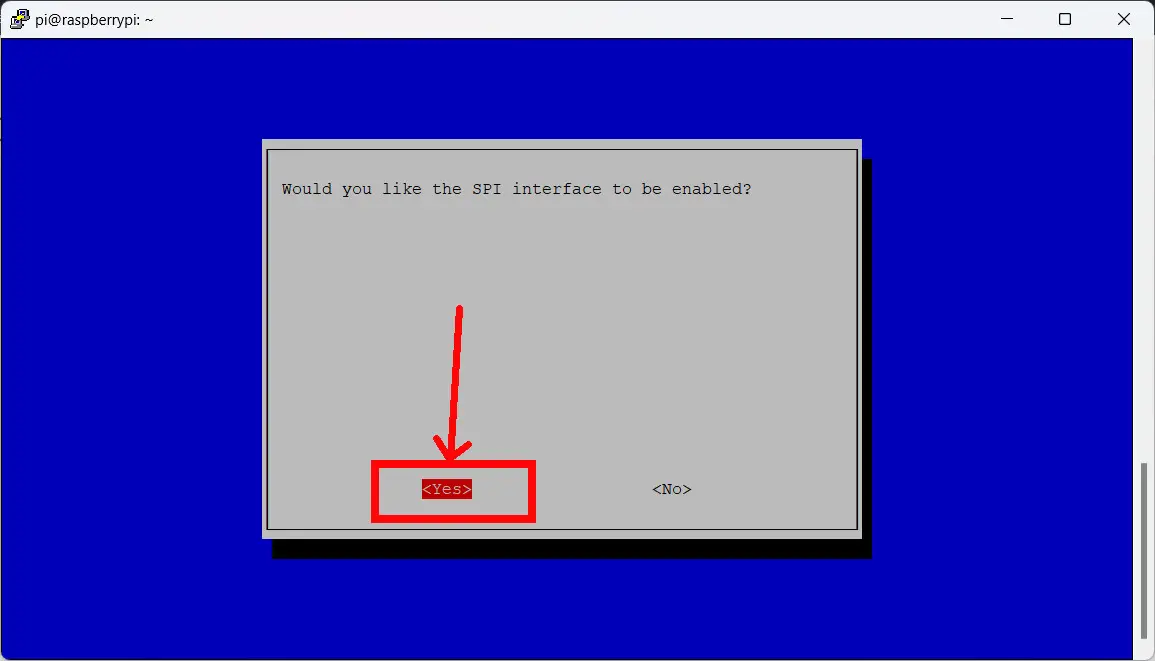
Enable the SPI interface with the “Yes” button:
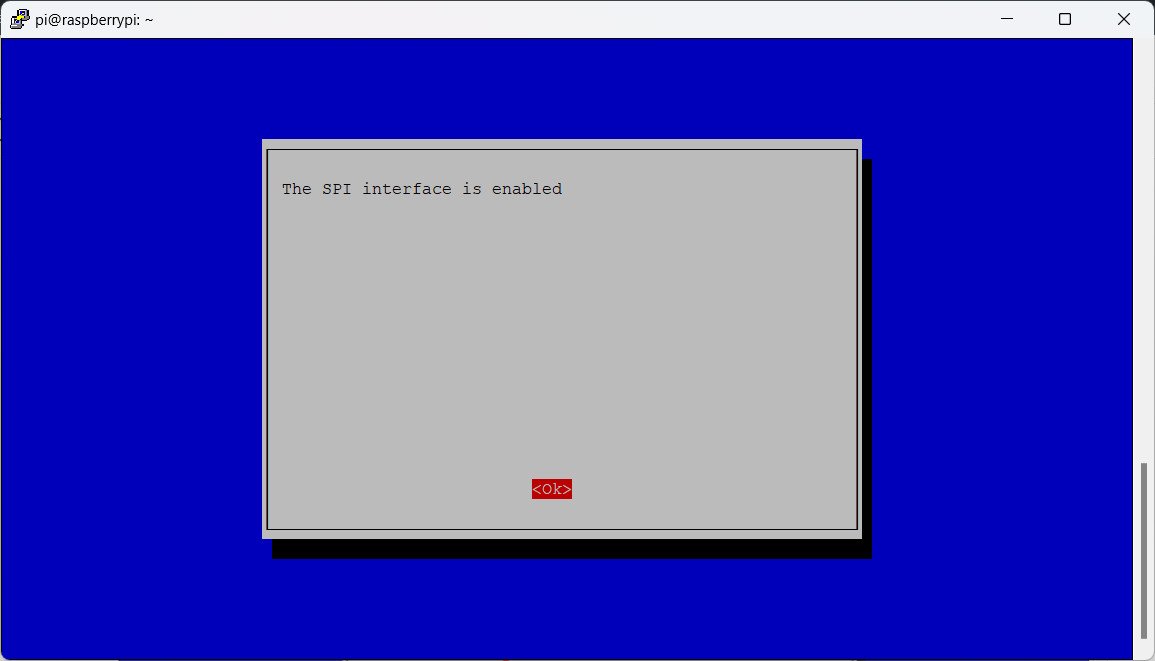
Click “Ok” to confirm:
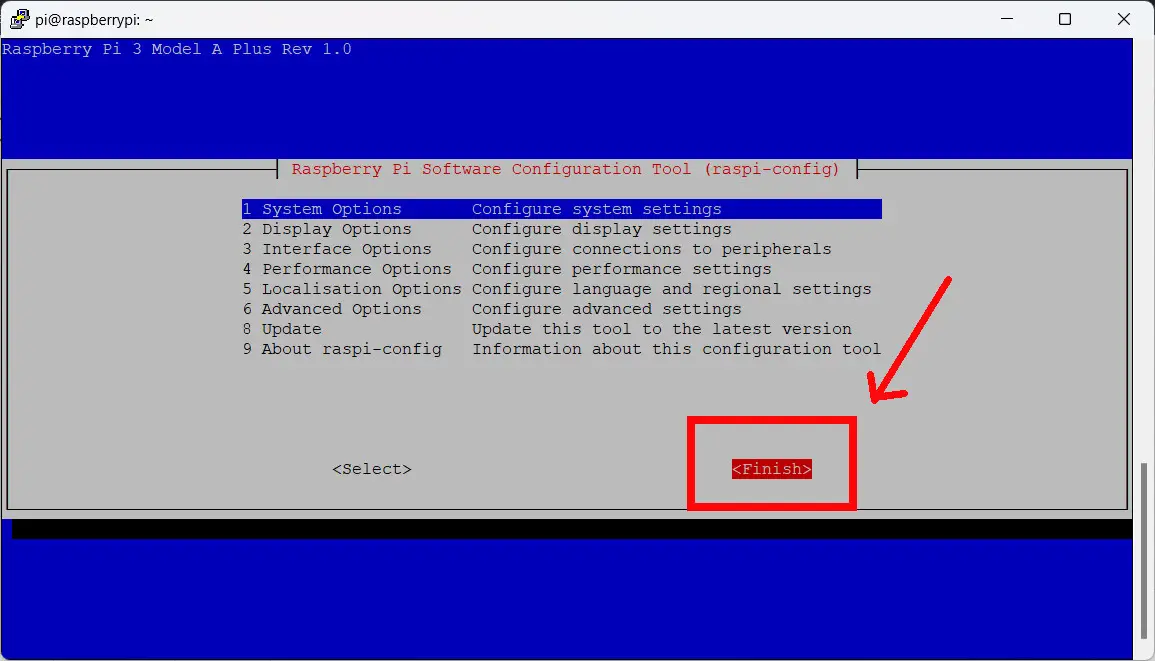
Back to the first windows, please click “Finish”:
You don’t need to reboot the Raspberry PI.
Get the e-Paper libraries
We’ll clone the Waveshare GitHub page in order to get the libraries and the test scripts for the e-ink display. I will get this copy directly in my “pi” user home (“/home/pi”). This can be achieved with the following command:
git clone https://github.com/waveshare/e-Paper.git
This will create a copy of the GitHub folder in your Raspberry PI. Please enter the following folder:
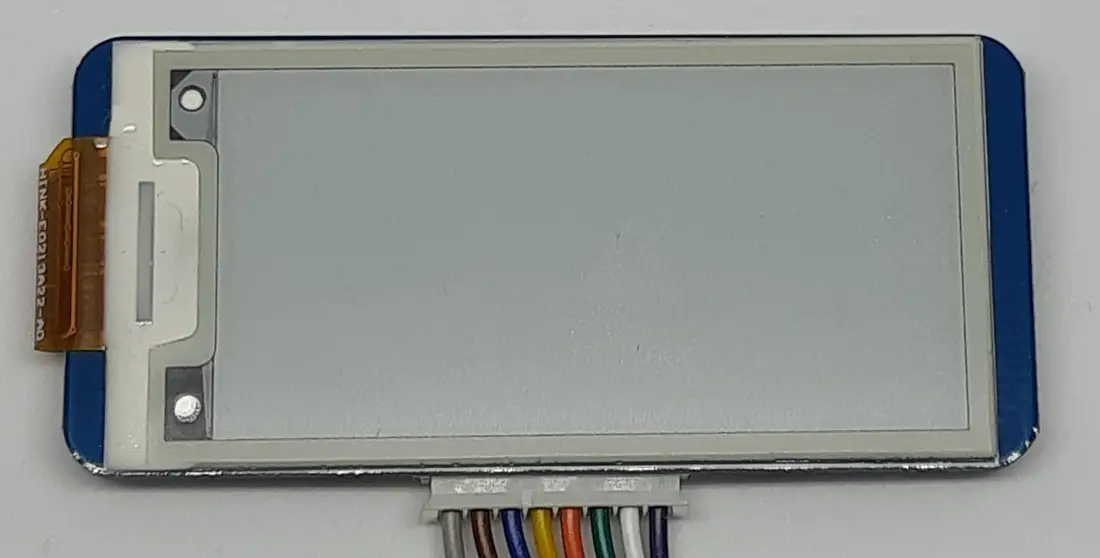
cd e-Paper/RaspberryPi_JetsonNano/python/examples/There are several example files, each one available to test different display sizes and hardware versions. Before performing tests, please check your display hardware version from the label usually attached to the back of the e-ink display board. As you can see in the following picture, the mine is the V2:
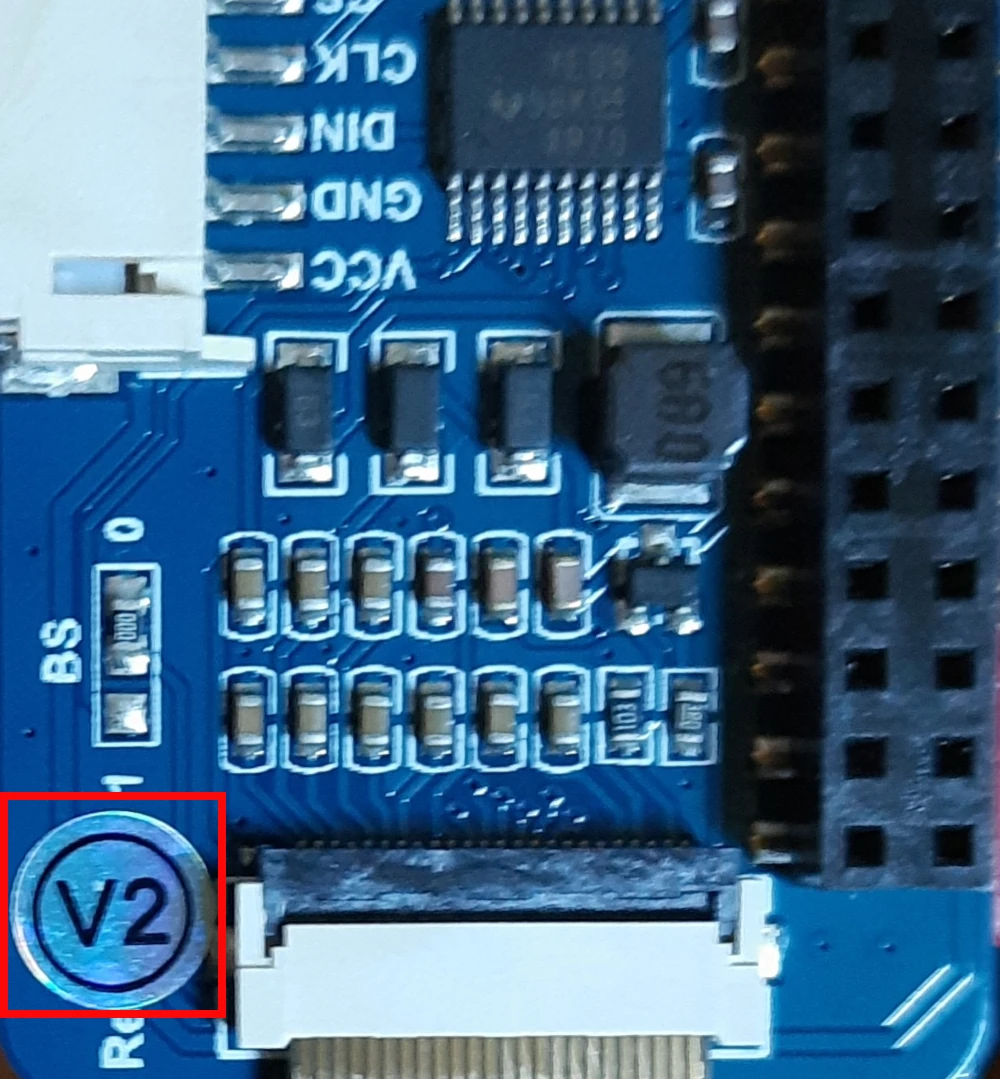
So, I have a 2.13 inch display with the V2 hardware, looking for the related file in the current folder, I found the “epd_2in13_V2_test.py”. Run the one that matches your e-ink display size and hardware version with Python, by using the following command (please change the script name with your one):
python3 epd_2in13_V2_test.pyIf everything works correctly, please make a copy of the script in your user folder for reference in case of doubts:
cp epd_2in13_V2_test.py /home/$USERGo back to your user home:
cd --E-Ink Coordinates
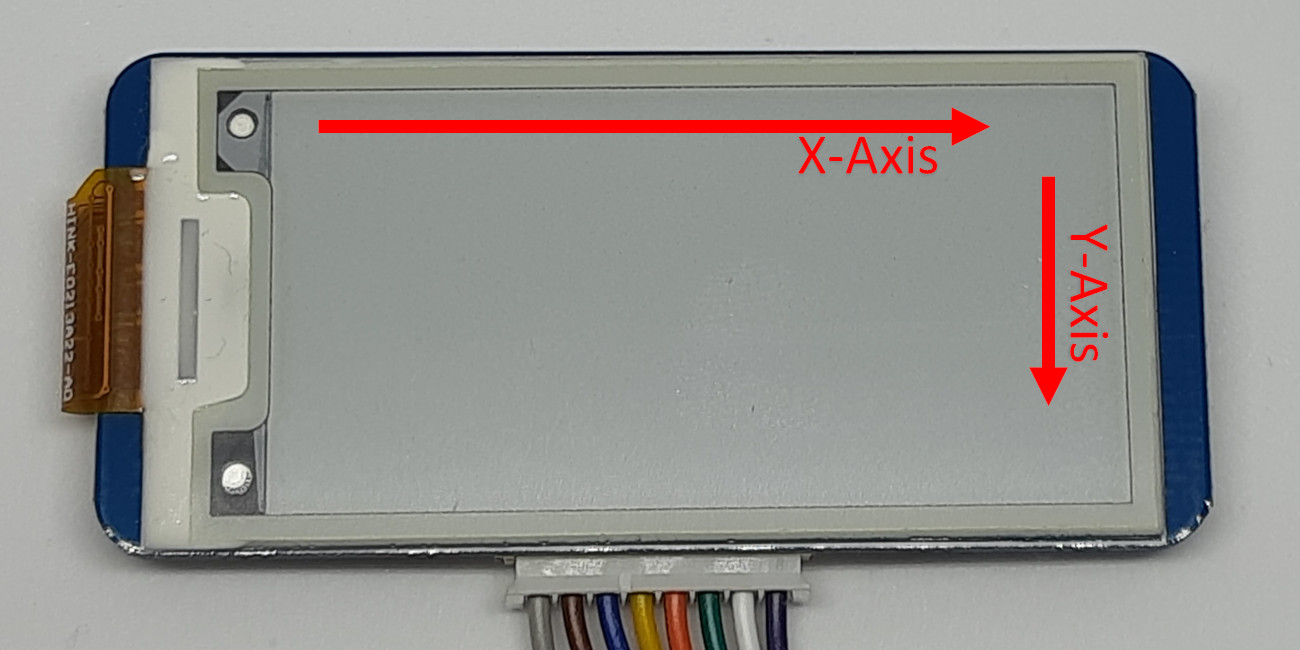
In the following examples I will ofwen refer to display coordinates. Usually thesse coordinates are calculated as the horizontal distance from the left side (X-Axis in the follwing picture) and the distance from the top side (Y-Axis from the following picture):
Use a Custom Raspberry PI e-Paper Script
I’ve arranged a custom test script with additional features compared to the standard example. You can use this to create your personal program. Please get my file in your Raspberry PI
wget https://peppe8o.com/download/python/e-paper/peppe8o-paper.pyThe script also uses a custom picture for an example that we’ll see later. You can download it with the following command, which will also save the file renaming to “peppe8o-logo.jpg”:
wget https://peppe8o.com/wp-content/uploads/2021/04/logo-peppe8o-512x512-1.jpg -O peppe8o-logo.jpgBefore explaining the script code, please note and edit the following lines. Open the file for editing:
nano peppe8o-paper.pyIn order to use this script from a different folder from the original one, we need to set the absolute path where the script can find the libraries and example pictures. Identify the following lines and change the “pi” user to your user:
picdir = "/home/pi/e-Paper/RaspberryPi_JetsonNano/python/pic"
libdir = "/home/pi/e-Paper/RaspberryPi_JetsonNano/python/lib"
If you have a different hardware version or a different size, please also identify the following line and edit accordingly (the example backup file will help if needed):
from waveshare_epd import epd2in13_V2Code explanation
We can now learn what are the main parts of the script, also looking at the display results.
The first line imports the modules sys, os, time, and traceback:
import sys, os, time, traceback
The following lines define the paths to the Waveshare picture directory (picdir) and library directory (libdir) where the script expects to find the original pictures and the library to make our e-ink display work. Please note that the picdir folder also contains the text fonts:
picdir = "/home/pi/e-Paper/RaspberryPi_JetsonNano/python/pic"
libdir = "/home/pi/e-Paper/RaspberryPi_JetsonNano/python/lib"
In order to have the libraries working, we also check if the libdir path exists and, if it does, we adds the path to the system path:
if os.path.exists(libdir): sys.path.append(libdir)
Finally, we can import the last module required to make the e-ink display work. Moreover, the PIL library will allow us to perform picture manipulation from the same script that manages the e-ink display:
from waveshare_epd import epd2in13_V2
from PIL import Image, ImageDraw, ImageFont, ImageEnhance
Every display action requires specifying the pixel color that we’re going to set. Using mnemonic names instead of 0 or 1 will make it easier to remember if we are showing a draw in black or white:
black = 0
white = 1
Clearing the display is a common task with e-ink devices. In order to make it simpler, I’ve added my script with the custom function clear_display(), which will allow you to get your display empty with a single line:
def clear_display(epd):
    global image, draw
    epd.Clear(0xFF)
    image = Image.new('1', (epd.height, epd.width), 255)
    draw = ImageDraw.Draw(image)
    epd.display(epd.getbuffer(image))
The following custom image makes this script unique. With the img_convert() function, you can turn any image supported by the Pillow library into a picture shown in your Raspberry PI e-ink display. We’ll see it in action in a few paragraphs.
This custom function requires as input the picture filename (you can use absolute or relative path) and the size (X ,and Y axis) you want to transform it.
The function opens the file with the Image.open().
def img_convert(img_file,X_new,Y_new):
    img = Image.open(img_file)
Then, it performs image manipulation to increase the original image contrast, increasing it by a “5” factor (you can edit this at your preference).
    enhancer = ImageEnhance.Contrast(img)
    contrast = 5
    img = enhancer.enhance(contrast)
The resulting image is converted to black & white:
img = img.convert('1')and finally resized to the required X and Y sizes, before returning the image object to the caller:
    img = img.resize((X_new,Y_new), Image.LANCZOS) # resize to new X,Y
    return img
We arrived now at the main loop. The “try … except” statements will just manage errors (if occurring) and interruptions.
The first lines will set the e-ink display initialization and clearing. Moreover, these lines will set different fonts (each one with different sizes):
try:
    epd = epd2in13_V2.EPD()
    epd.init(epd.FULL_UPDATE)
    epd.Clear(0xFF)
    time.sleep(2)
    font15 = ImageFont.truetype(os.path.join(picdir, 'Font.ttc'), 15)
    font24 = ImageFont.truetype(os.path.join(picdir, 'Font.ttc'), 24)
    font32 = ImageFont.truetype(os.path.join(picdir, 'Font.ttc'), 32)
The following tests will show different drawing uses.
Each example will start by resetting the display to empty and will also show, at the top, a text telling what test number it’s going to perform.
Please note also that the real moment where the display will show your drawing is at the command “epd.display(epd.getbuffer(image))“
The first test shows how to use different text fonts. the draw.text(start_point, text_to_show, font, color) function uses 4 inputs:
- start_point: is the coordinate of the top-left point where your text will be placed in the e-ink display
- text_to_show: is the text string to show
- font: is the font to use for text
- color: is black or white, depending on the color you want to use for your text
The example will show 3 different text fonts:
    clear_display(epd)
    draw.text((0, 0), 'Test 1) Draw text', font = font15, fill = black)
    draw.text((10, 15), 'test 15', font = font15, fill = black)
    draw.text((10, 31), 'text 24', font = font24, fill = black)
    draw.text((10, 63), 'text 32', font = font32, fill = black)
    epd.display(epd.getbuffer(image))
    time.sleep(2)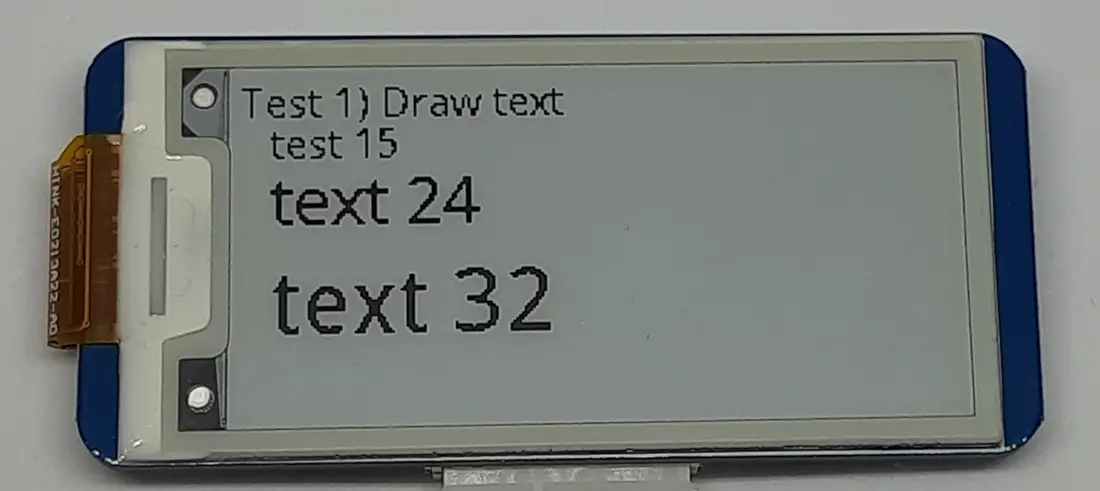
The second test will show how to draw a simple line. The draw.line(line_coordinates, line_color, line_width)” will require the following inputs:
- line_coordinates: a list object with the start point coordinates and the end point coordinates of the line. Each point is in rounded parenthesis, while the whole coordinates input must stay inside square parenthesis: [(X_start, Y_start),(X_end, Y_end)]
- line_color: the color of the line (white or black)
- line_width: the width of the line (integer number)
The example will show a simple line, after cleaning the display:
    clear_display(epd)
    draw.text((0, 0), 'Test 2) Draw line', font = font15, fill = black)
    draw.line([(0,20),(50,100)], fill = 0,width = 5)
    epd.display(epd.getbuffer(image))
    time.sleep(2)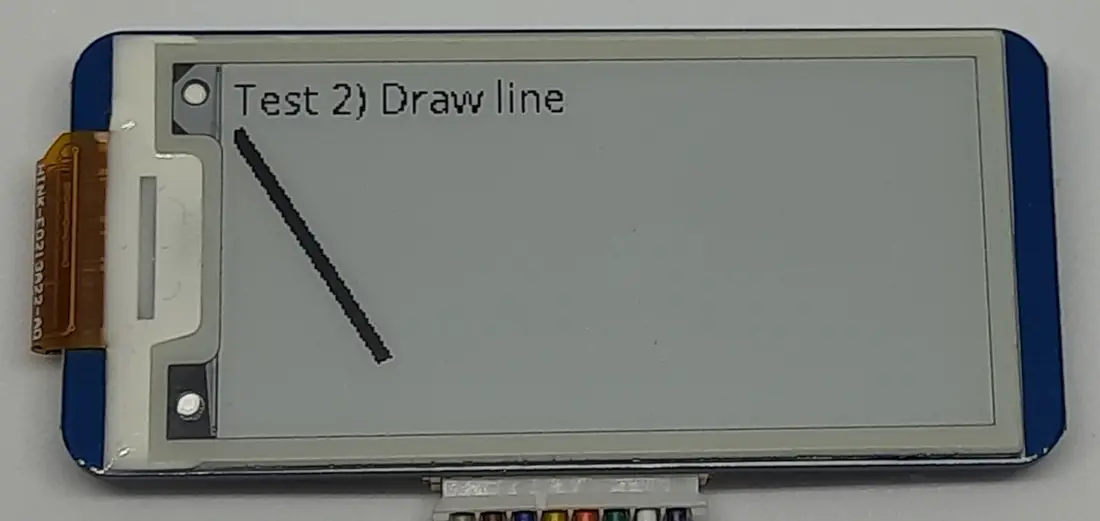
Now, we move to rectangles. Also for rectangles, you have to identify the coordinates of the top-left corner (as the start point) and the bottom-right corner (as the end point). There are 2 types of rectangles: it can be just a border drawing or a filled with a specified color.
The “draw.rectangle(rect_coordinates, outline_color)” will show an empty rectange with the border defined by lines of the specified outline color, while the “draw.rectangle(rect_coordinates, fill_color)” will print on the e-ink display a solid rectangle.
    clear_display(epd)
    draw.text((0, 0), 'Test 3) Draw Rectangles', font = font15, fill = black)
    draw.rectangle([(0,20),(50,60)],outline = black)
    draw.rectangle([(50,20),(100,60)],fill = black)
    epd.display(epd.getbuffer(image))
    time.sleep(2)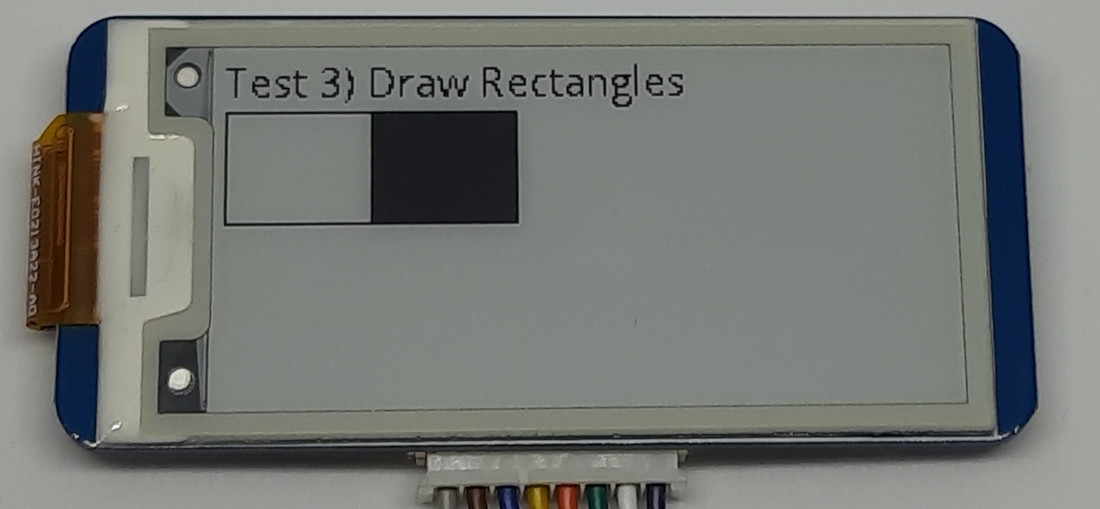
The following example will show you how to draw chords, bordered ellipses or filled ellipses.
Differently from the previous examples, the draw.chord() and draw.ellipse() will require their coordinates as a set of 4 numbers, still specifying the X_start, Y_start, X_end, Y_end. In these cases, these coordinates are still identifying a rectangle that will contain the required ellipse, so defining the ellipse width and height.
Moreover, the draw.chord() will allow you to set the degrees of chord to draw:
- draw.chord(ellipse_coordinates, start_degrees, end_degrees, fill_color)
- ellipse_coordinates: a 4-number element with coordinates as (X_start, Y_start, X_end, Y_end)
- start_degrees: a number identifying the degrees where the chord starts. 0 degrees means the right side of the ellipse
- end_degrees: a number identifying the degrees where the chord ends
- fill_color: the chord line color, black or white
- draw.ellipse(ellipse_coordinates, fill_color)
- ellipse_coordinates: a 4-number element with coordinates as (X_start, Y_start, X_end, Y_end)
- fill_color: the color used to fill the ellipse, black or white
Here is the example code:
    clear_display(epd)
    draw.text((0, 0), 'Test 4) Draw Chords', font = font15, fill = black)
    draw.chord((0, 20, 100, 70), 0, 360, fill = black)
    draw.ellipse((0, 70, 100, 120), outline = black)
    epd.display(epd.getbuffer(image))
    time.sleep(2)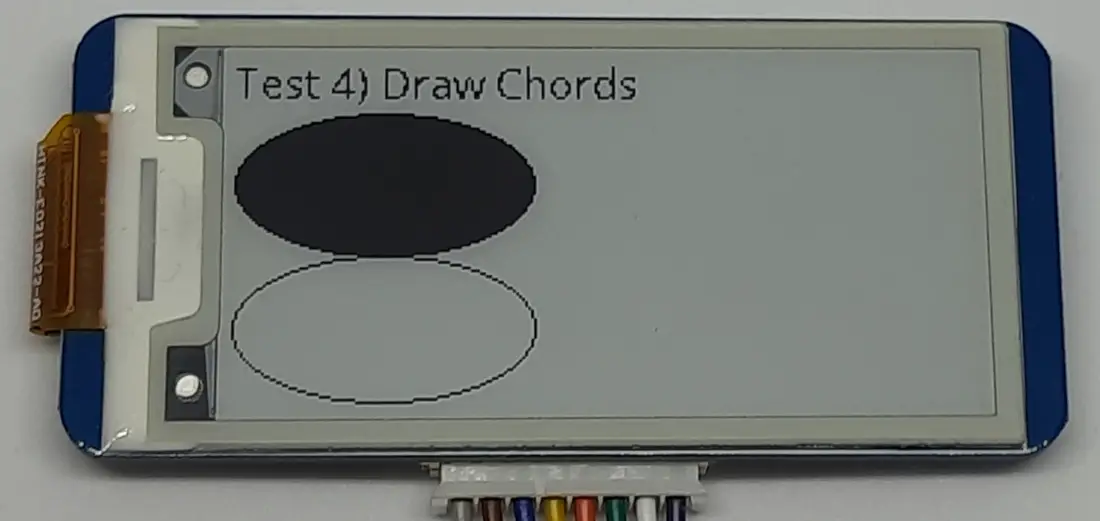
Similarly to the chord, the pie slices will show chords and add the lines that will close the pie to the ellipse center. this kind of drawing can be filled or outlined:
    clear_display(epd)
    draw.text((0, 0), 'Test 4) Draw Pie Slices', font = font15, fill = black)
    draw.pieslice((0, 20, 100, 110), 90, 180, outline = black)
    draw.pieslice((0, 20, 100, 110), 180, 270, fill = black)
    epd.display(epd.getbuffer(image))
    time.sleep(2)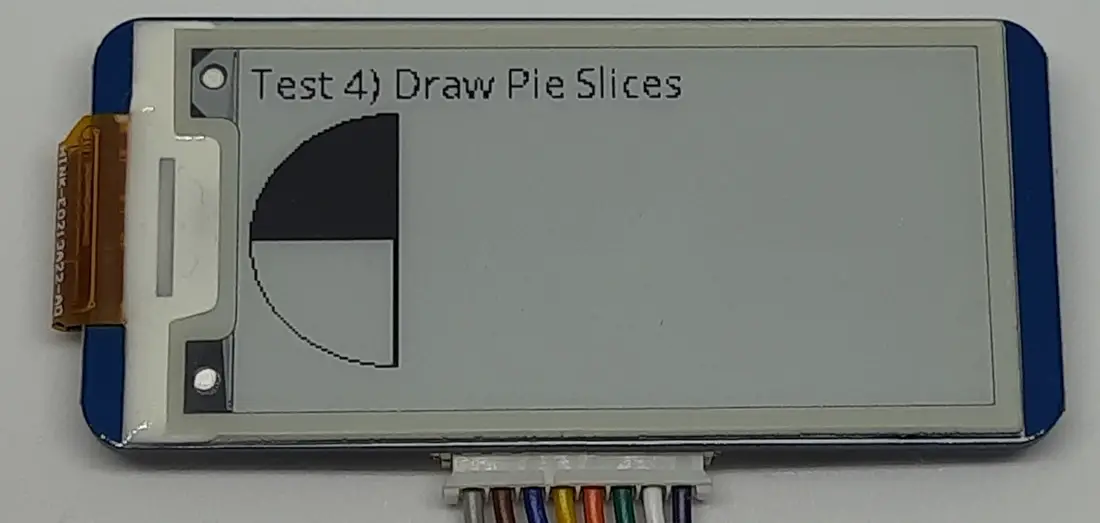
Polygons give you more flexibility to draw complex shapes. They are composed of an ordered series of points connected with lines. the polygons are closed with a final line that will join the last point of the series with the first one. Polygon can be also only bordered or filled:
    clear_display(epd)
    draw.text((0, 0), 'Test 5) Draw Polygons', font = font15, fill = black)
    draw.polygon([(0,20),(110,60),(150,35)],outline = black)
    draw.polygon([(190,20),(190,60),(150,40)],fill = black)
    epd.display(epd.getbuffer(image))
    time.sleep(2)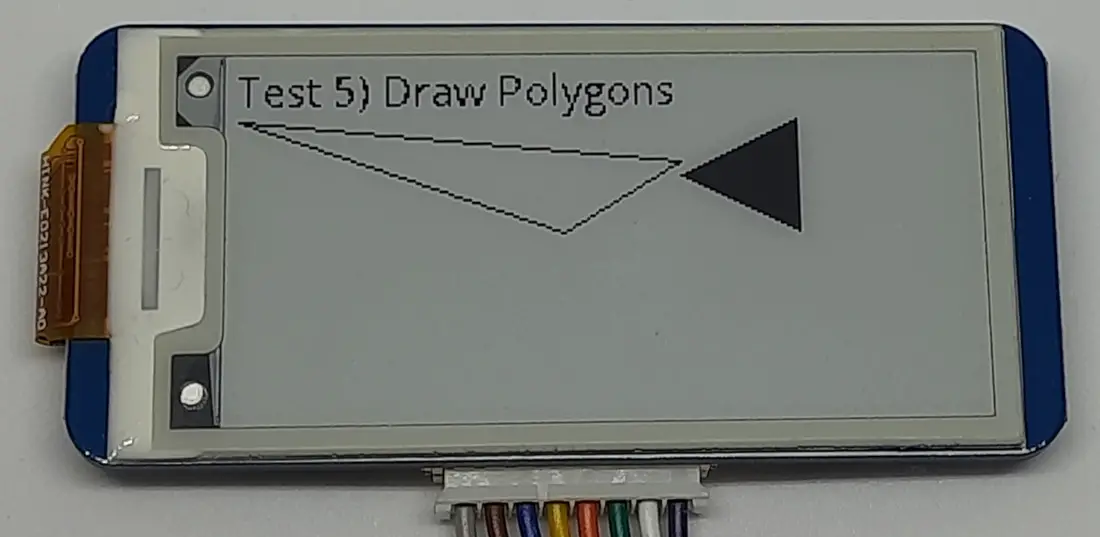
With the Waveshare library, showing bitmap pictures in your Raspberry PI e-ink display is really simple. It is enough to call the image.open() of Pillow library and the required picture will be shown. You have to keep attention to providing a bitmap that is in black & white and fits the e-ink display max size. Waveshare provides a set of example images to try. The first is the following, which will fill the entire display (so we can’t add text to the image):
    clear_display(epd)
    image = Image.open(os.path.join(picdir, '2in13.bmp'))
    epd.display(epd.getbuffer(image))
    time.sleep(2)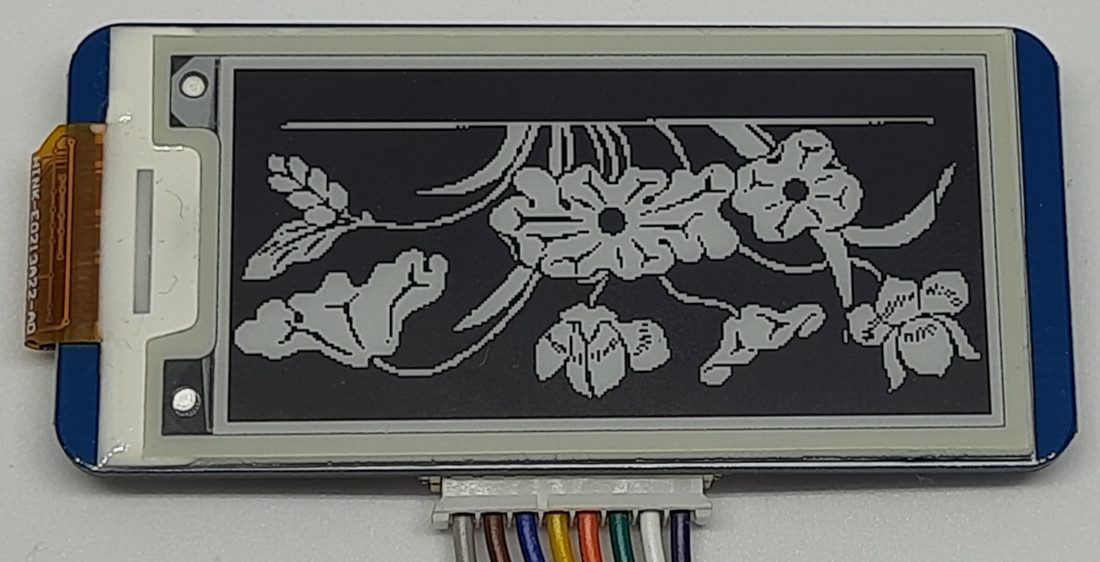
If you have a smaller image, you can use the image.paste() function to place your image at a specific position. In this case, you can also add text:
    clear_display(epd)
    bmp = Image.open(os.path.join(picdir, '100x100.bmp'))
    image.paste(bmp, (20,20))
    draw.text((0, 0), 'Test 7) Smaller Bitmap', font = font15, fill = black)
    epd.display(epd.getbuffer(image))
    time.sleep(2)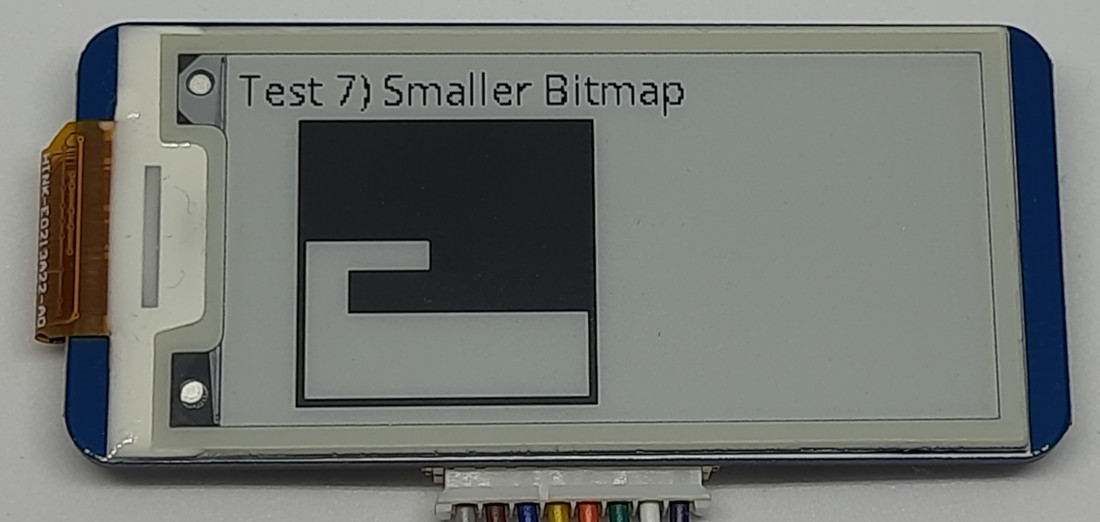
Sometimes, we can also need to use a number of images that can vary or can be dynamically uploaded to our Raspberry PI with a format different from a black & white bitmap.
In this case, the img_convert() custom function will allow us to use whatever jpg picture (or any format supported by Pillow) and show it in our display. The following example will use the peppe8o logo image (which is a 512×512 px jpg) shown below:
converting it on the fly to a 64×64 picture enabled to be shown in our e-ink display:
    clear_display(epd)
    img = img_convert("peppe8o-logo.jpg",64,64)
    image.paste(img, (20,20))
    draw.text((0, 0), 'Test 8) Custom image', font = font15, fill = black)
    epd.display(epd.getbuffer(image))
    time.sleep(2)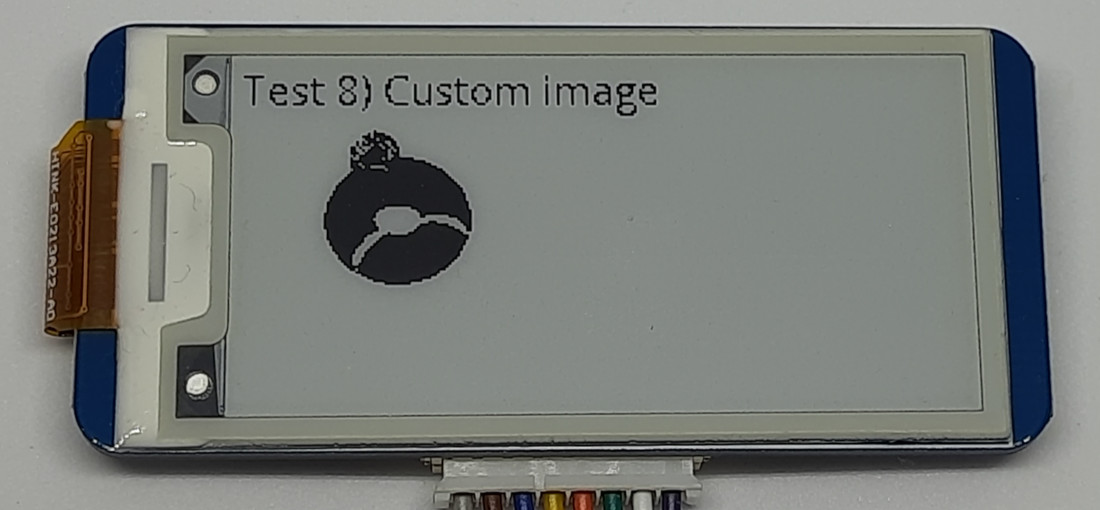
The final test is about partial updates. To say the truth, I don’t love continuously updating an e-ink display as it has a limited number of refreshes (even if very big) and I think that you can use the full power of this kind of display when you want to show a static image which changes with a very low frequency.
The test shows partial updates on the e-ink display by showing a clock that runs for 10 seconds, with an inverse progress bar.
epd.displayPartBaseImage initializes the e-ink display to partial update mode. Then, a loop is executed for 10 seconds, continuously updating the image on the display.
The elapsed time will adjust the width of the progress bar by calculating at each loop the width of the first 3 rectangles. The 4th rectangle will just cover at each run the old time characters, in order to avoid the overlapping between old characters and new ones.
The updated image is displayed using epd.displayPartial, and there’s a pause of 0.2 seconds between each update.
After the end of the while loop, the display is switched back to full update mode.
    clear_display(epd)
    draw.text((0, 0), 'Test 9) Partial Updates', font = font15, fill = black)
    epd.displayPartBaseImage(epd.getbuffer(image))
    epd.init(epd.PART_UPDATE)

    num = 0
    start_time=time.time()
    elapsed = time.time()-start_time
    while (time.time()-start_time) <= 10:
        elapsed=time.time()-start_time
        progress = int(220-int(elapsed*10))
        draw.rectangle((120, 70, progress, 75), fill = black)
        draw.rectangle((progress, 70, 220, 75), fill = white)
        draw.rectangle([(progress,70),(220,75)],outline = black)

        draw.rectangle((120, 80, 220, 105), fill = white)
        draw.text((120, 80), time.strftime('%H:%M:%S'), font = font24, fill = black)
        epd.displayPartial(epd.getbuffer(image))
        time.sleep(0.2)
    epd.init(epd.FULL_UPDATE)
    time.sleep(2)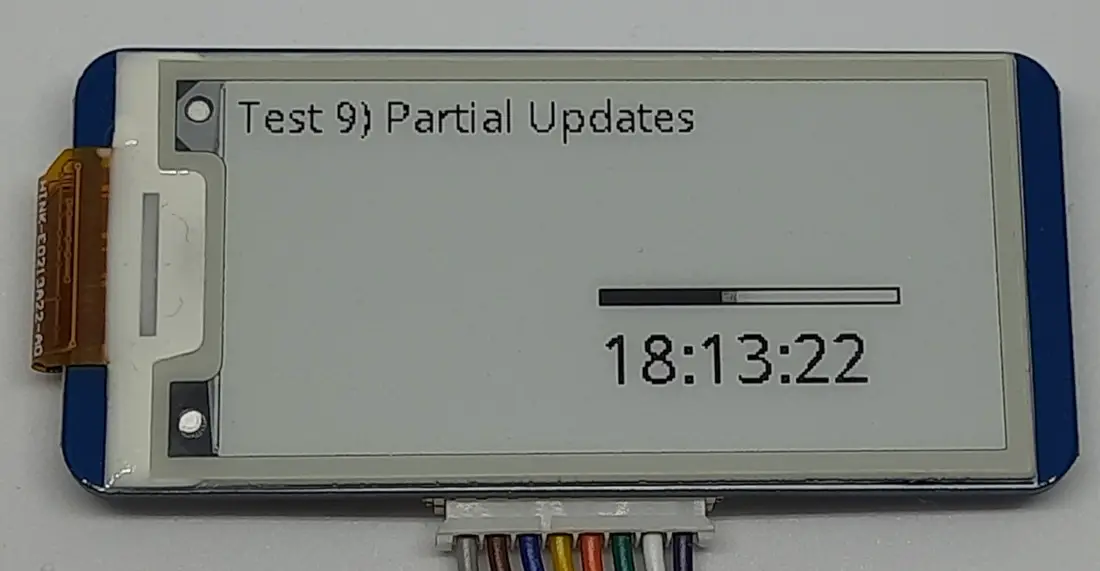
Finally, the last banner will warn you that the tests have finished and set the display to sleep mode.
The sleep mode is really important as it allows you to save a lot of power consumption (the e-ink display can show the last picture even without a current).
Please remember that, after the sleep mode, you will need to initialize again the display to control it.
    clear_display(epd)
    draw.text((0, 0), 'Tests finished', font = font15, fill = 0)
    draw.text((0, 15), 'Visit peppe8o.com for more tutorials', font = font15, fill = 0)
    epd.display(epd.getbuffer(image))
    time.sleep(5)

    clear_display(epd)
    print("Goto Sleep...")
    epd.sleep()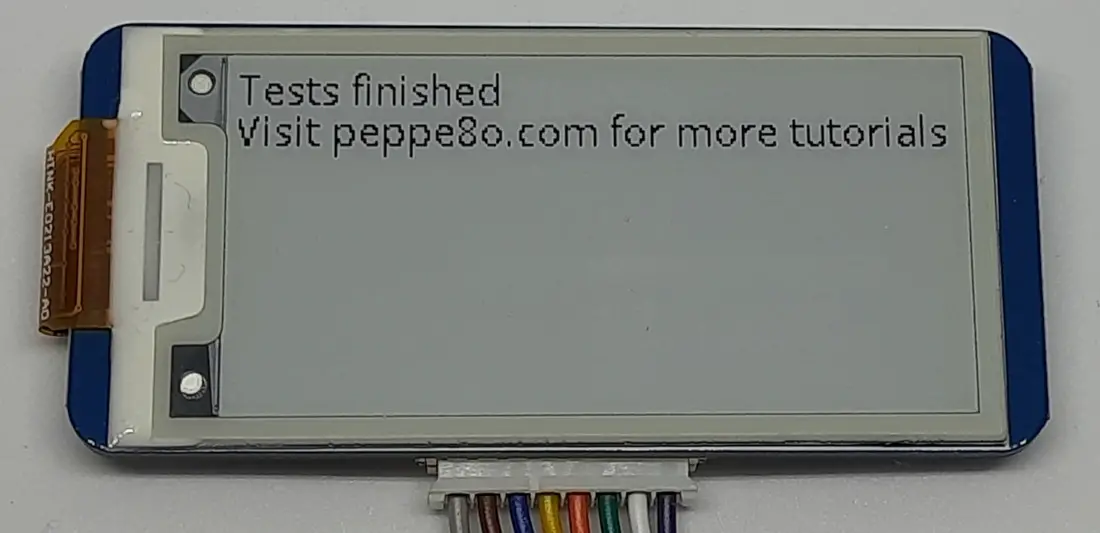
The final except statements will manage any errors which could raise during the program execution:
except IOError as e:
    print(e)

except KeyboardInterrupt:
    print("ctrl + c:")
    epd2in13_V2.epdconfig.module_exit()
    exit()
Next Steps
Are you interested in more projects with your RPI computer board? Take a look at peppe8o Raspberry PI computer tutorials pages.
Enjoy your Raspberry PI e-ink display!
Open source and Raspberry PI lover, writes tutorials for beginners since 2019. He's an ICT expert, with a strong experience in supporting medium to big companies and public administrations to manage their ICT infrastructures. He's supporting the Italian public administration in digital transformation projects.
![]()
![]()
![]()
![]()
![]()
![]()
![]()