Last Updated on 12th April 2024 by peppe8o
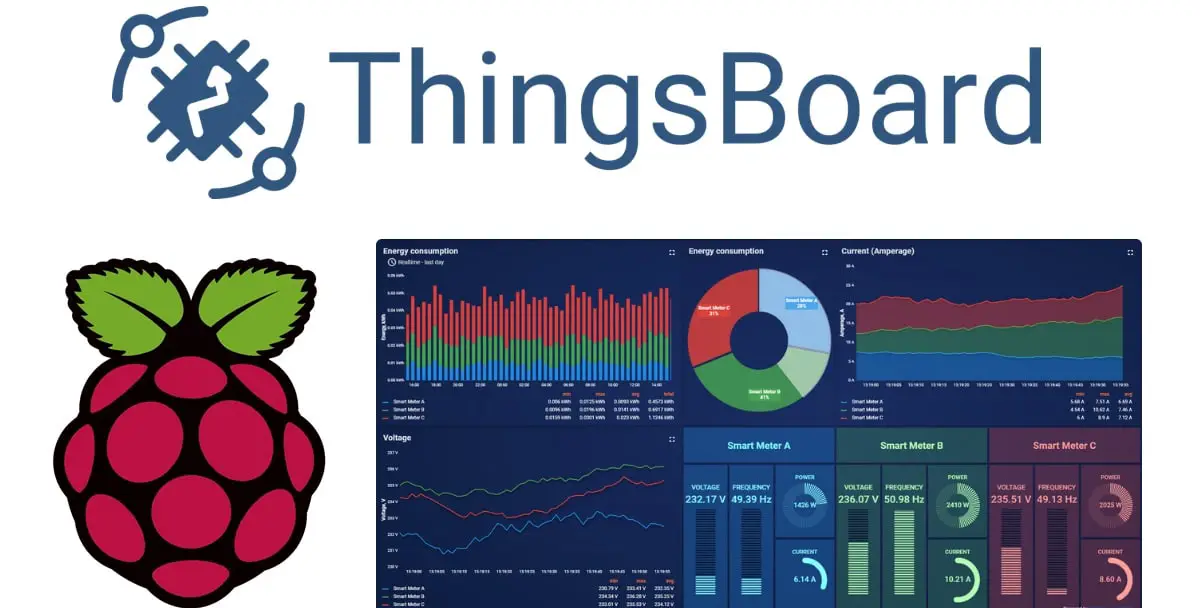
In this tutorial, I’m going to show you how to create a tenant, add a device and configure it to message by MTTQ and Python with Thingsboard on Raspberry PI. We’ll start from a fresh ThingsBoard installation, according to my ThingsBoard and Raspberry PI: getting a Professional IoT dashboard tutorial.
Creating a tenant and adding a first device is the next step once you installed ThingsBoard on Raspberry PI. A simple monitoring task is by checking internal CPU temperature
There are different ways to use Mosquitto (MQTT) messages via Python. In this case, I’m going to install Mosquitto to the Raspberry PI OS and use it from a python script that simulates console commands. In this way, you can use the same python script to send any desired bash output to ThingsBoard in an easy and fully customizable way.
As requirements and installation have been already explained in the previous post, we’ll go directly on the procedure.
Step-by-Step Procedure
Login as System Administrator with the credentials you get in the previous post. Please also remember as soon to change System Admin email/password with your custom ones, as it is a best practice for your security.
Create a ThingsBoard Tenant
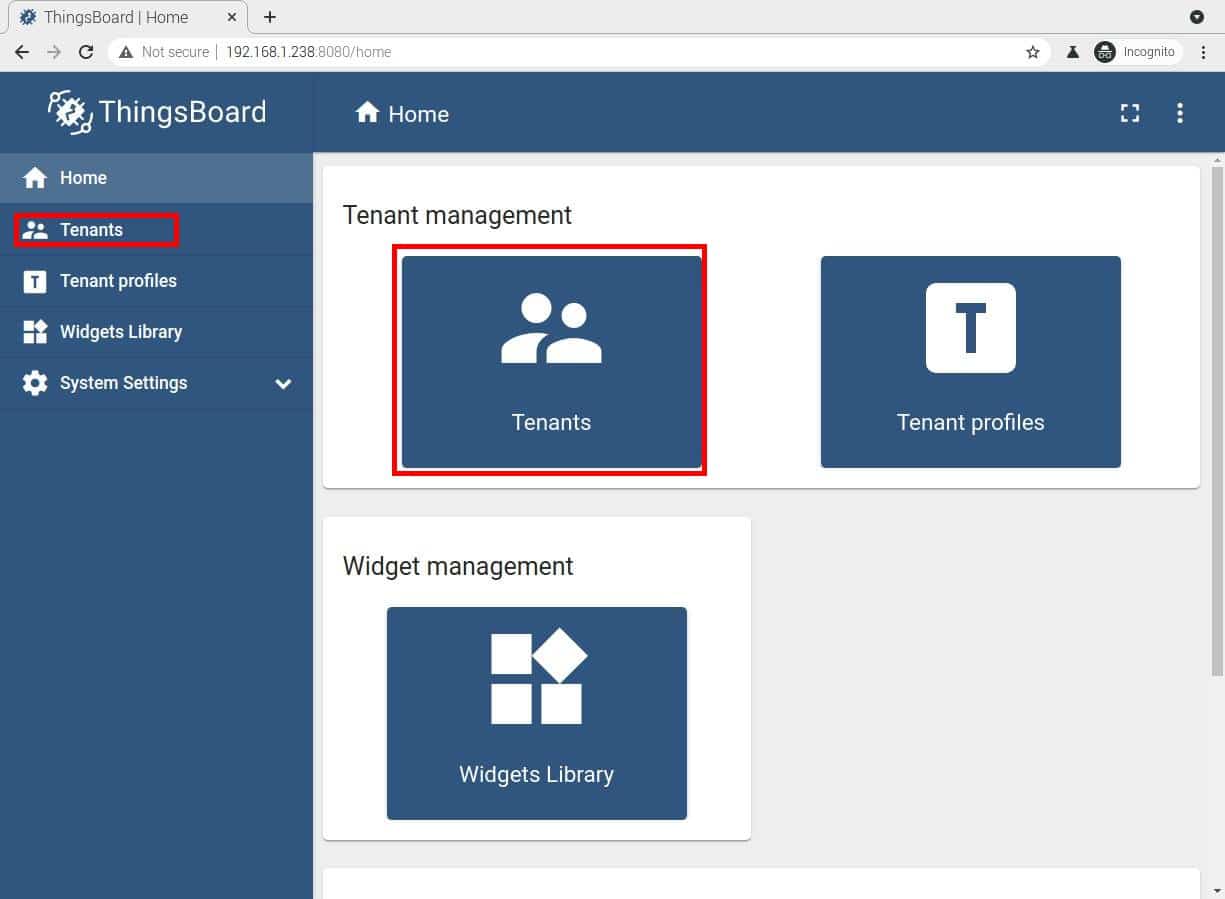
We’ll need to create a Tenant in order to create dashboards. From System Admin dashboard, go to tenants by clicking the related icon or sidebar link:
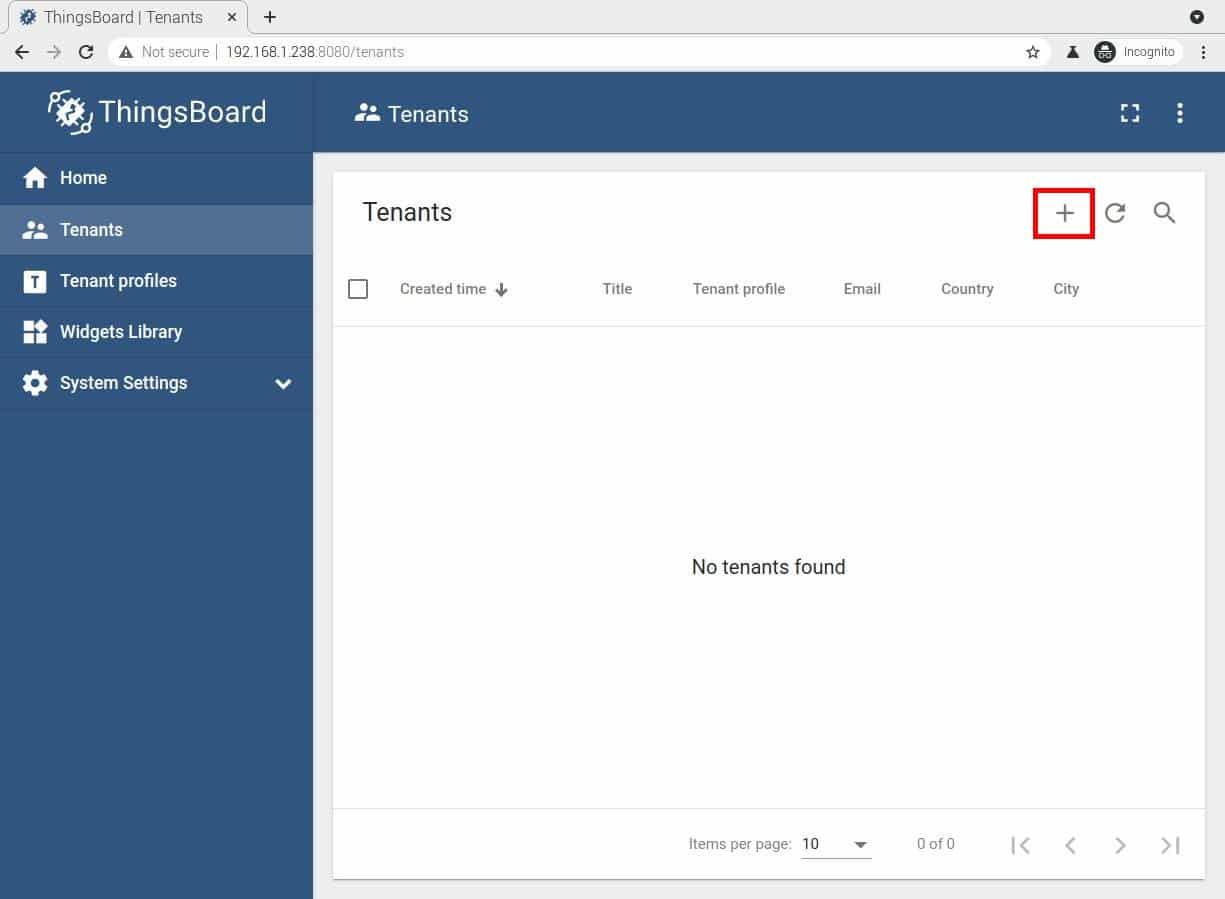
Click the cross symbol on top-right to create a new tenant:
Please fill mandatory fields (marked by an asterisk). I’ve used “Home” as Title and I left “Default” as Tenant Profile:
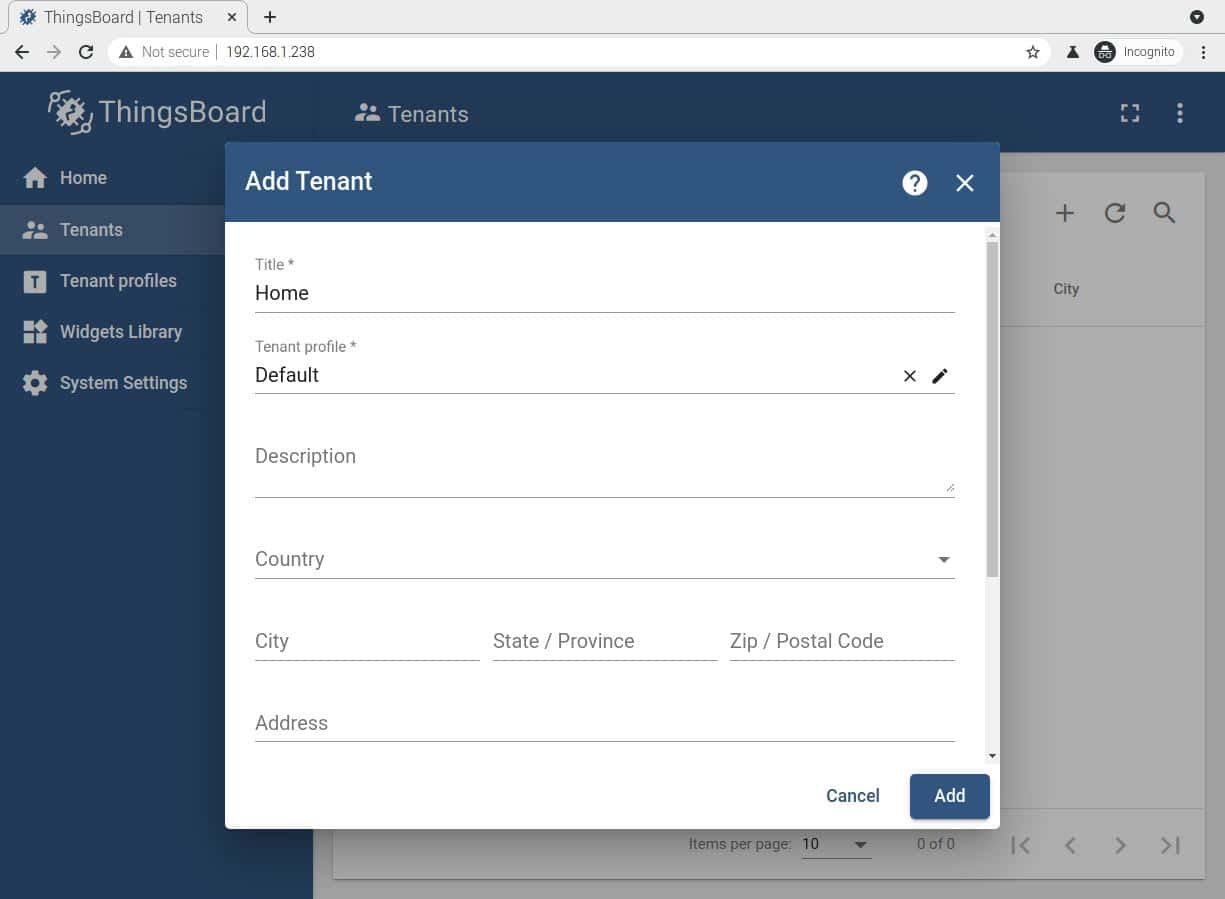
Then click the “Add” button in bottom-right part of this window.
Create a Tenant Admin
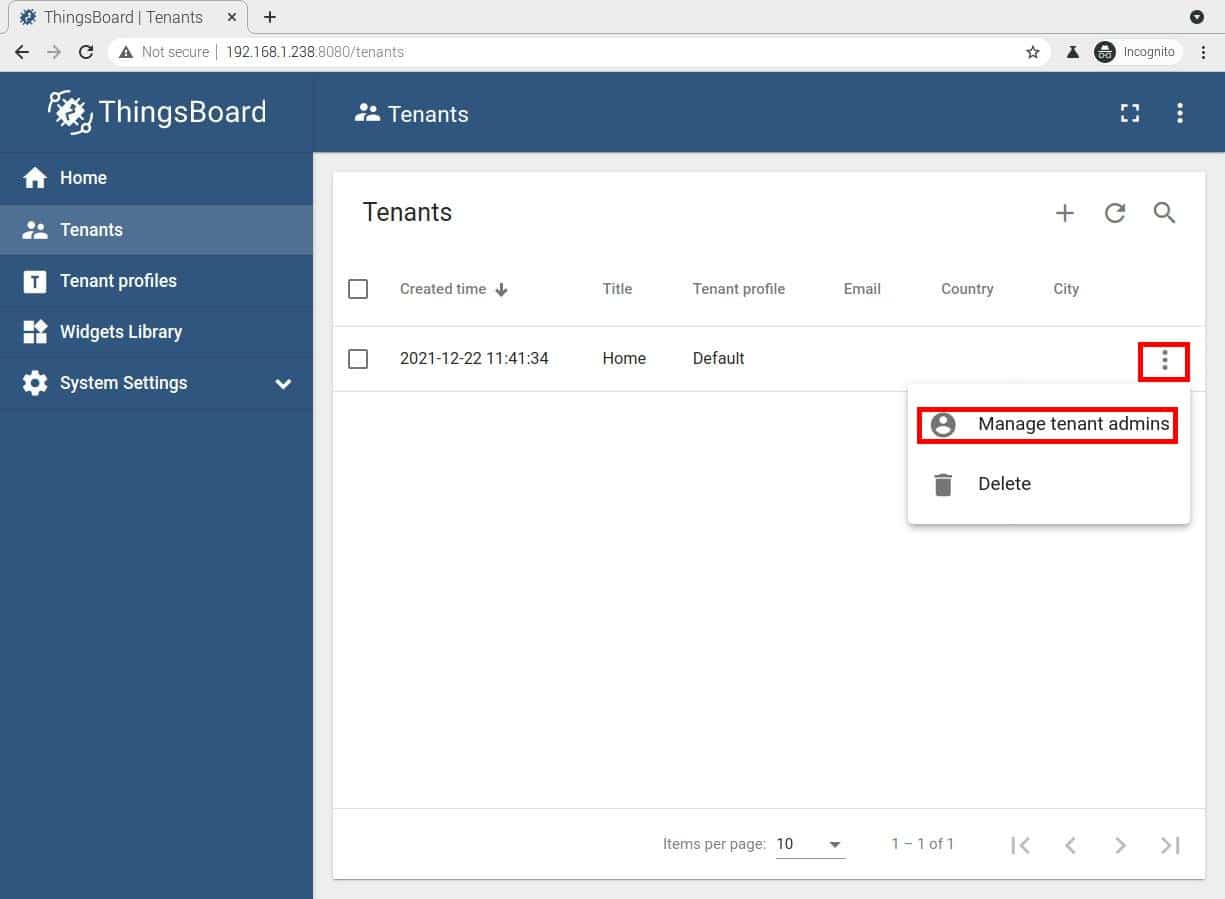
The new tenant now appears in our list. Use the hamburger menù (highlighted in the following picture) to open available options and click “Manage tenant admins”:
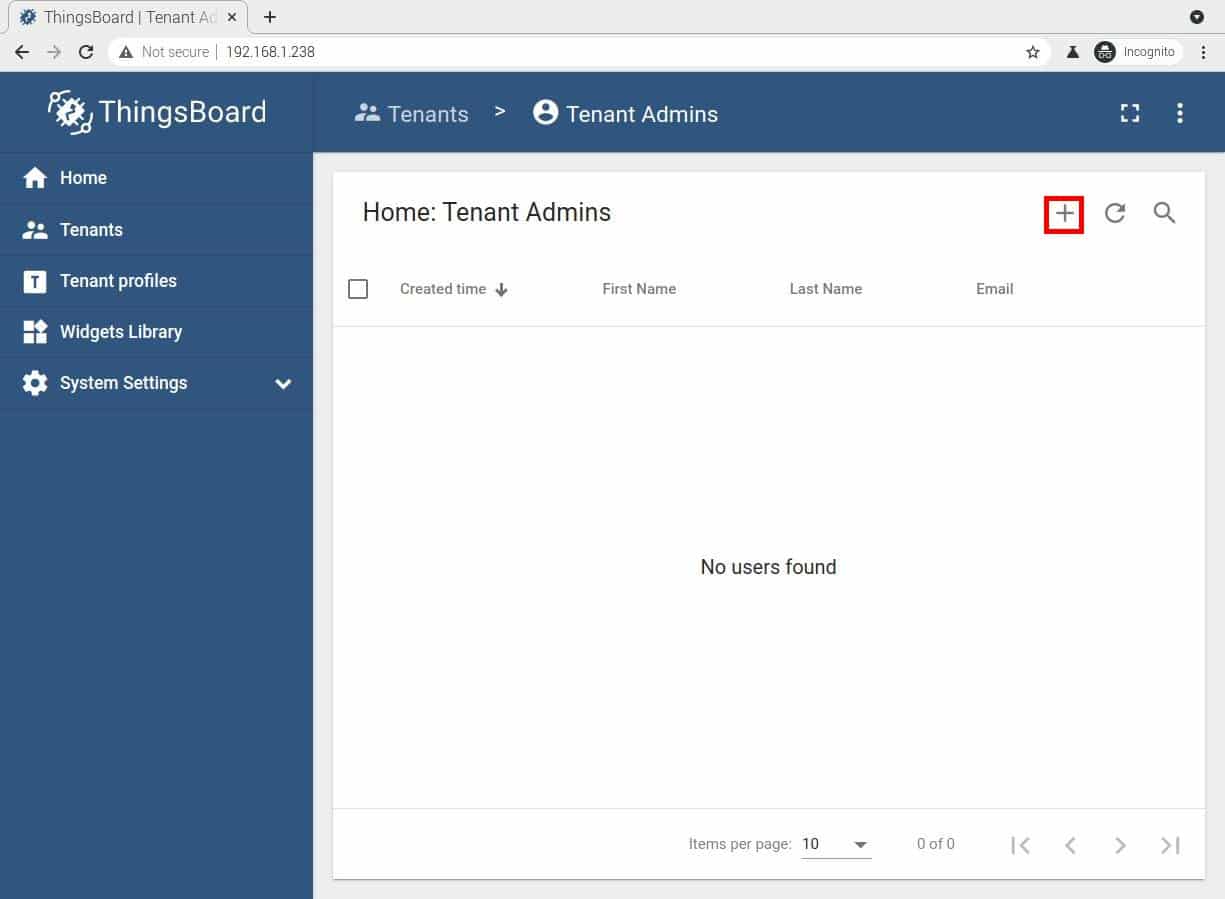
On the next page, please use the button with the cross symbol to add a new tenant admin:
On the following page, please fill in at least the email field. As we don’t have still configured the email sending, we can also proceed with an activation link, by keeping sure that the “Activation method” is set to “Display Activation Link”:
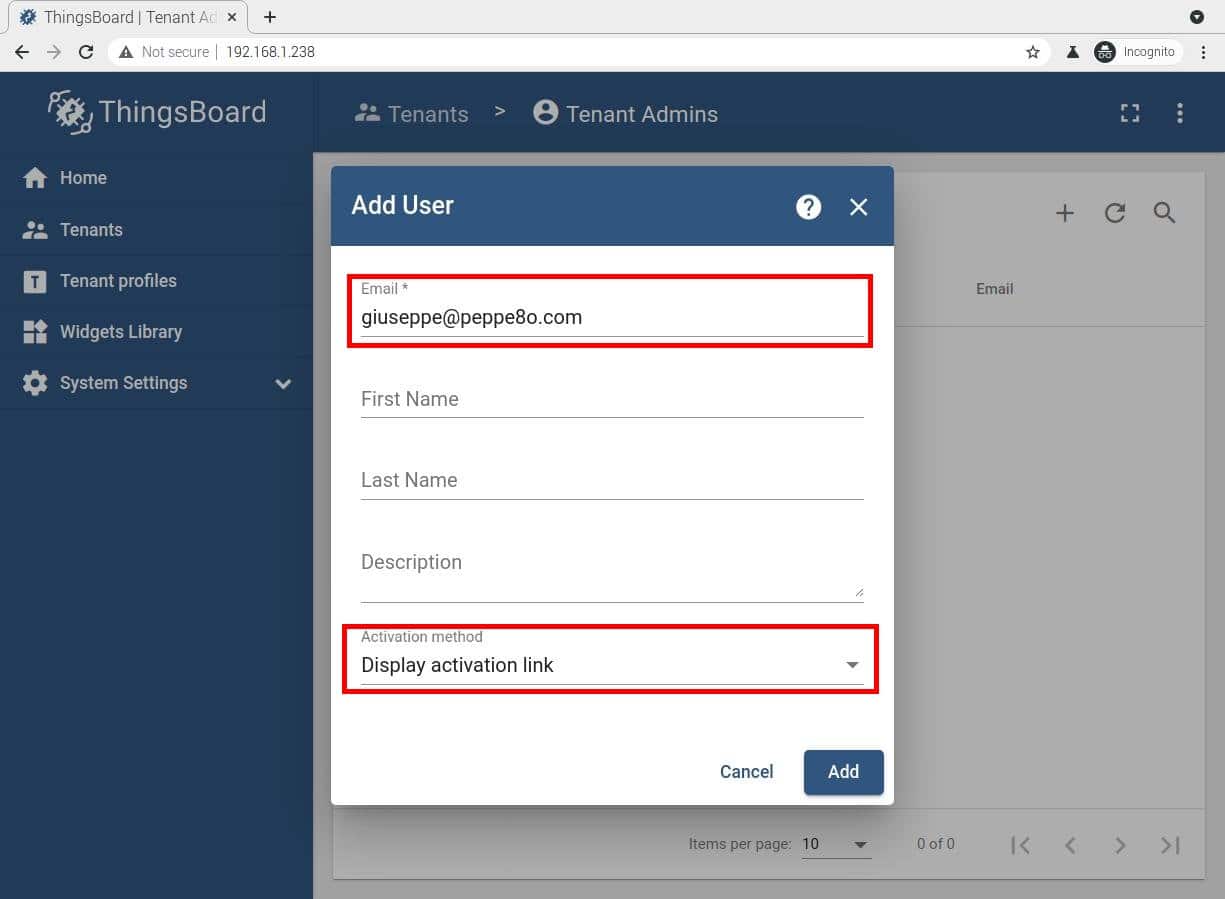
Finally, please click the “Add” button. This will generate an activation link to get your tenant admin active:
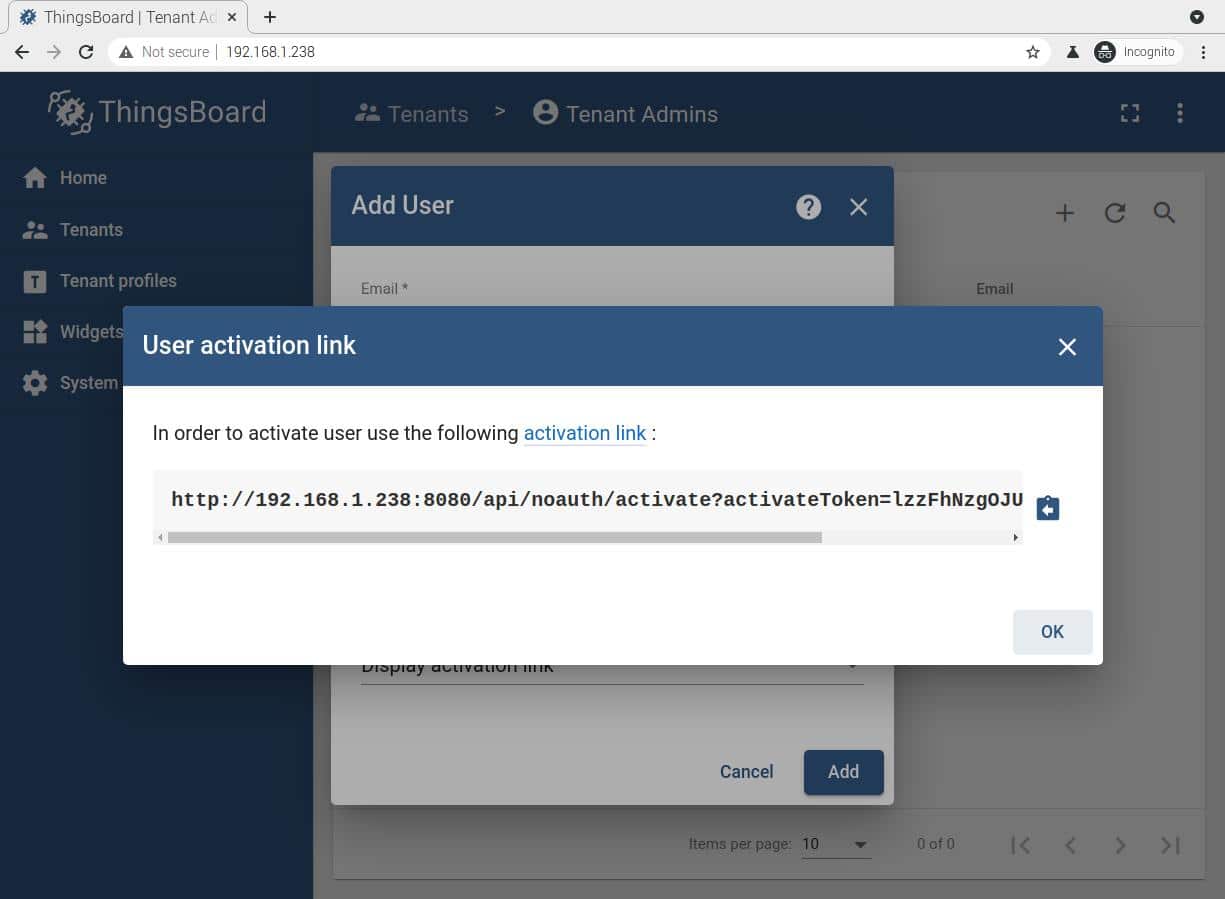
Copy the activation link and use it in a new browser tab. You will be asked first to create a password for your tenant admin:
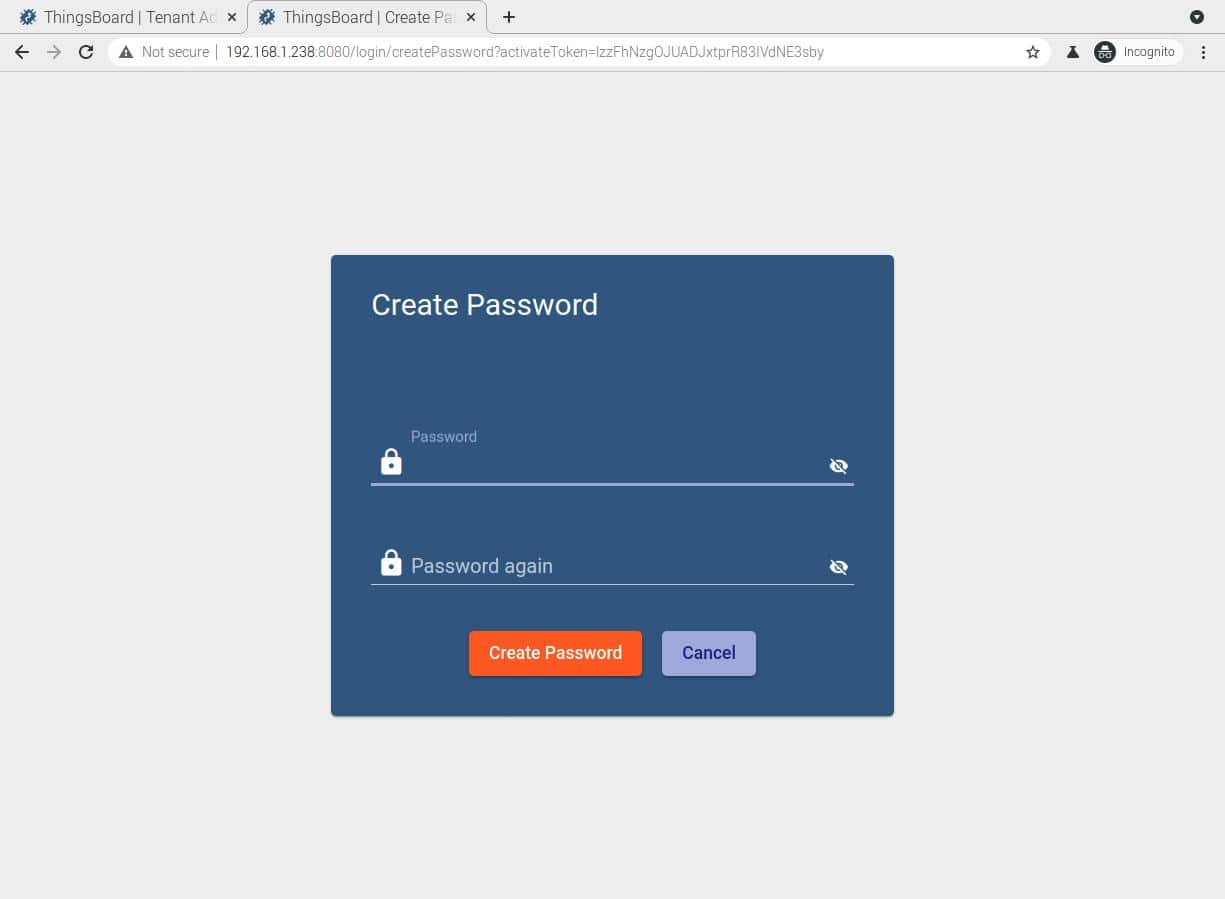
Fill in the password you like and then click the “Create Password” button. Please save in a safe place your email and password registered here as you will use these for all the next access.
You will be logged in to the tenant admin home page. From here you can associate assets, devices and create dashboards.
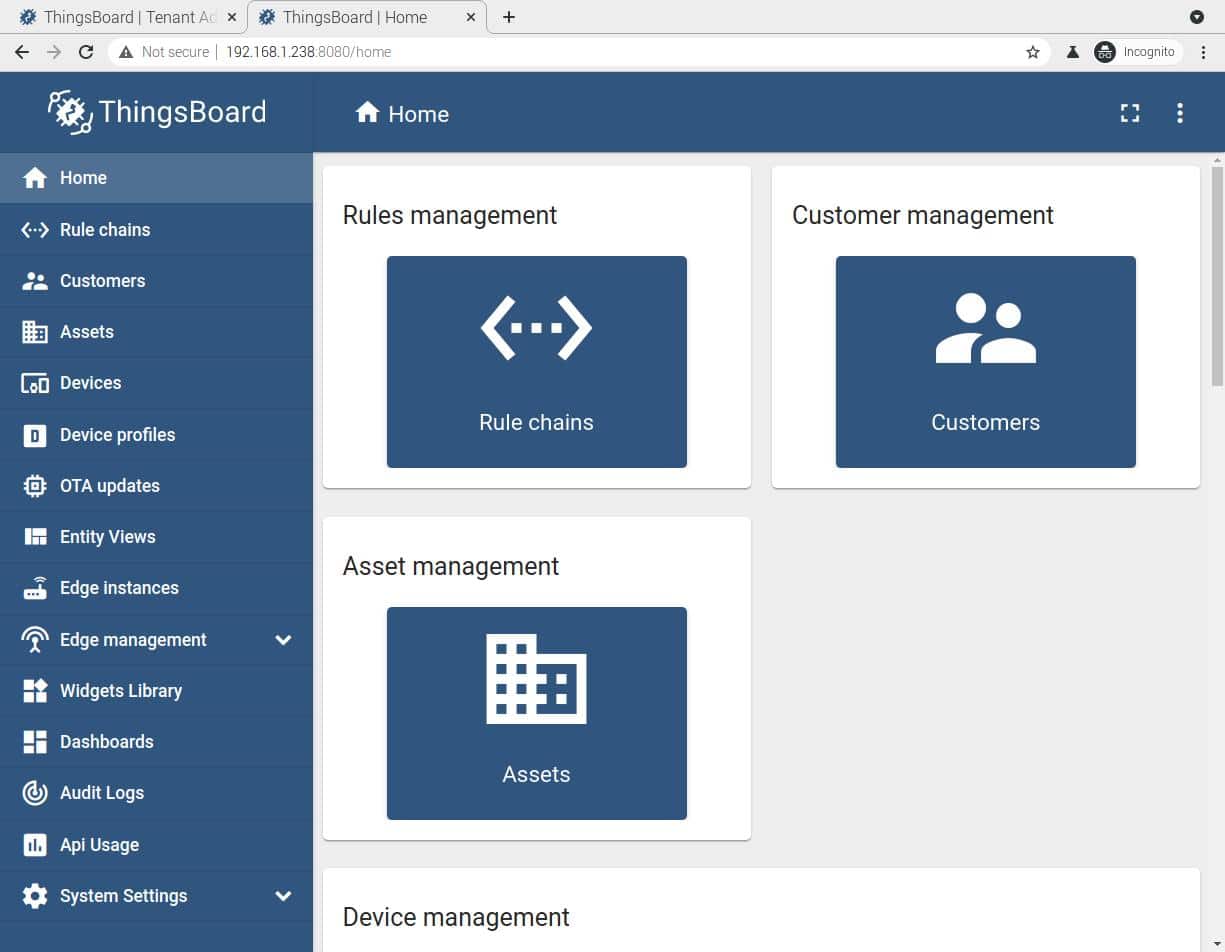
Create a new Device
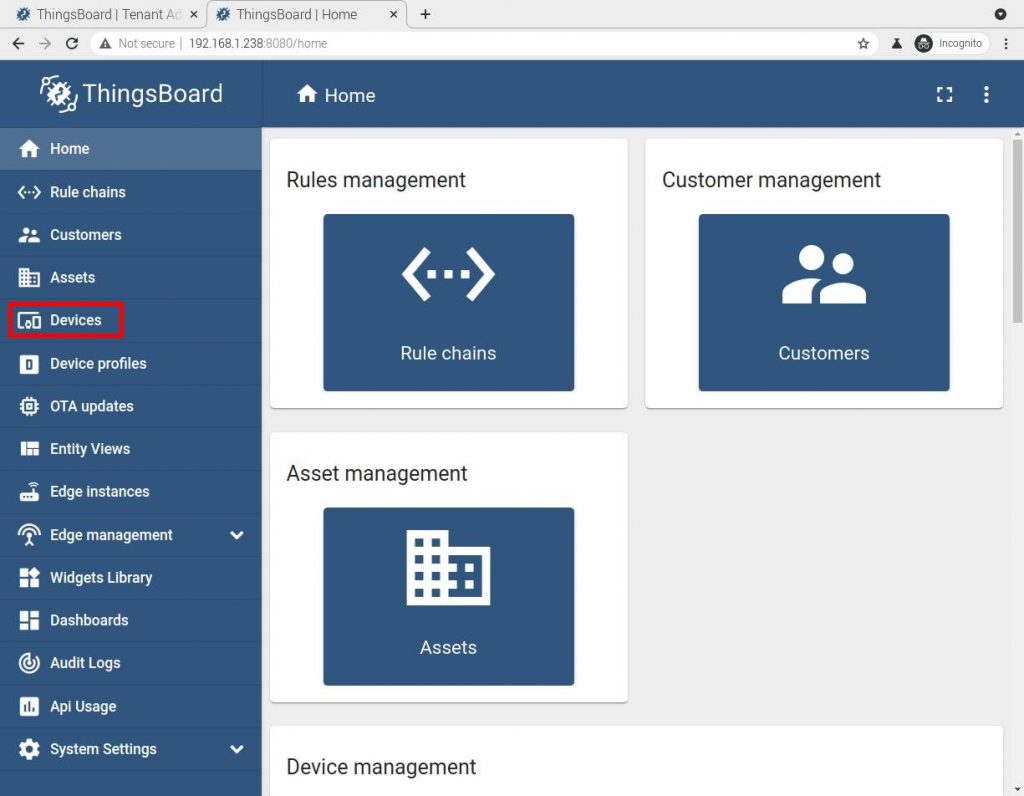
Now, let’s create our first device, which will be the same Raspberry PI running ThingsBoard. We’ll monitor CPU temperature. Click on the Devices link from the sidebar menu:
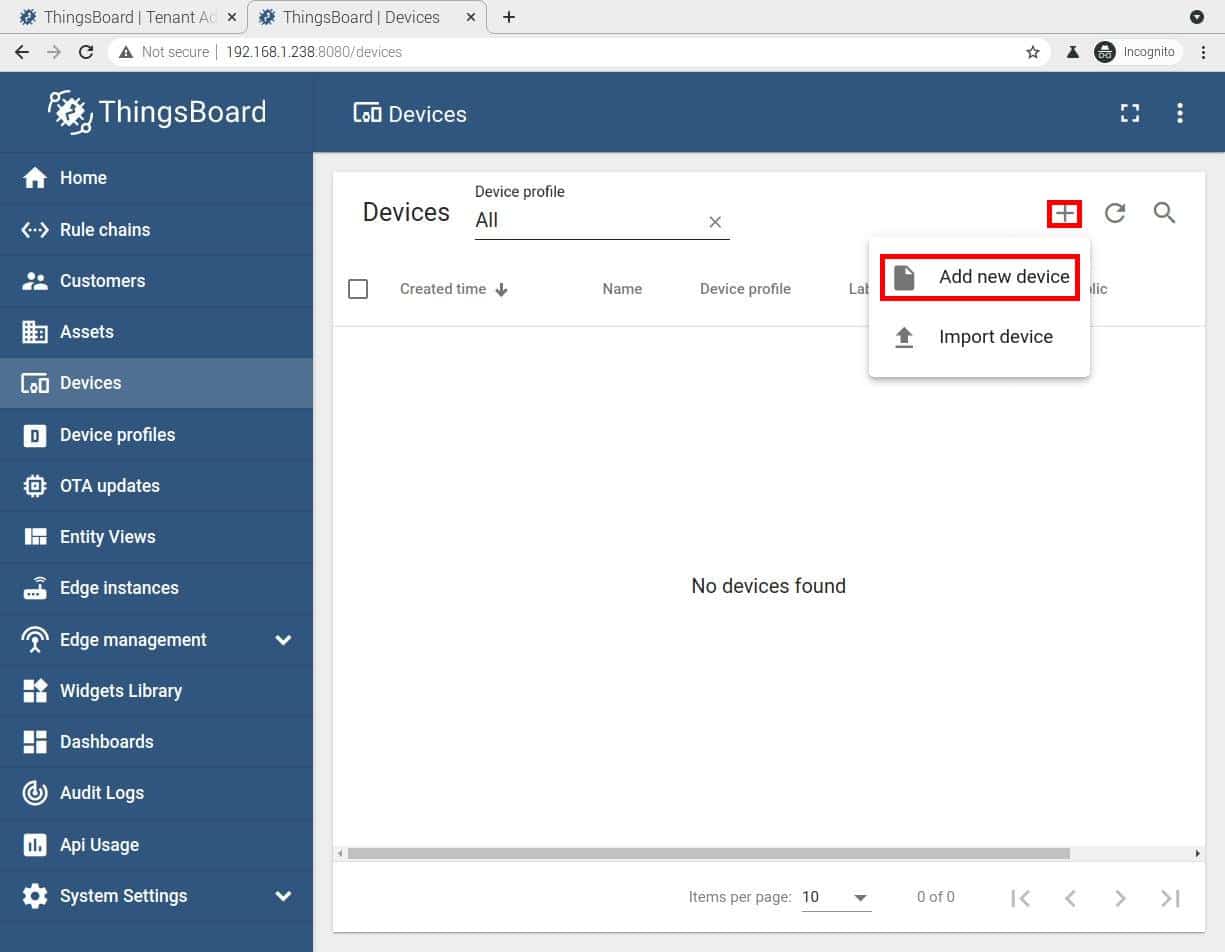
From the Devices page, which will be empty, please click the button with the cross symbol and then “Add new Device”, as highlighted in the following picture:
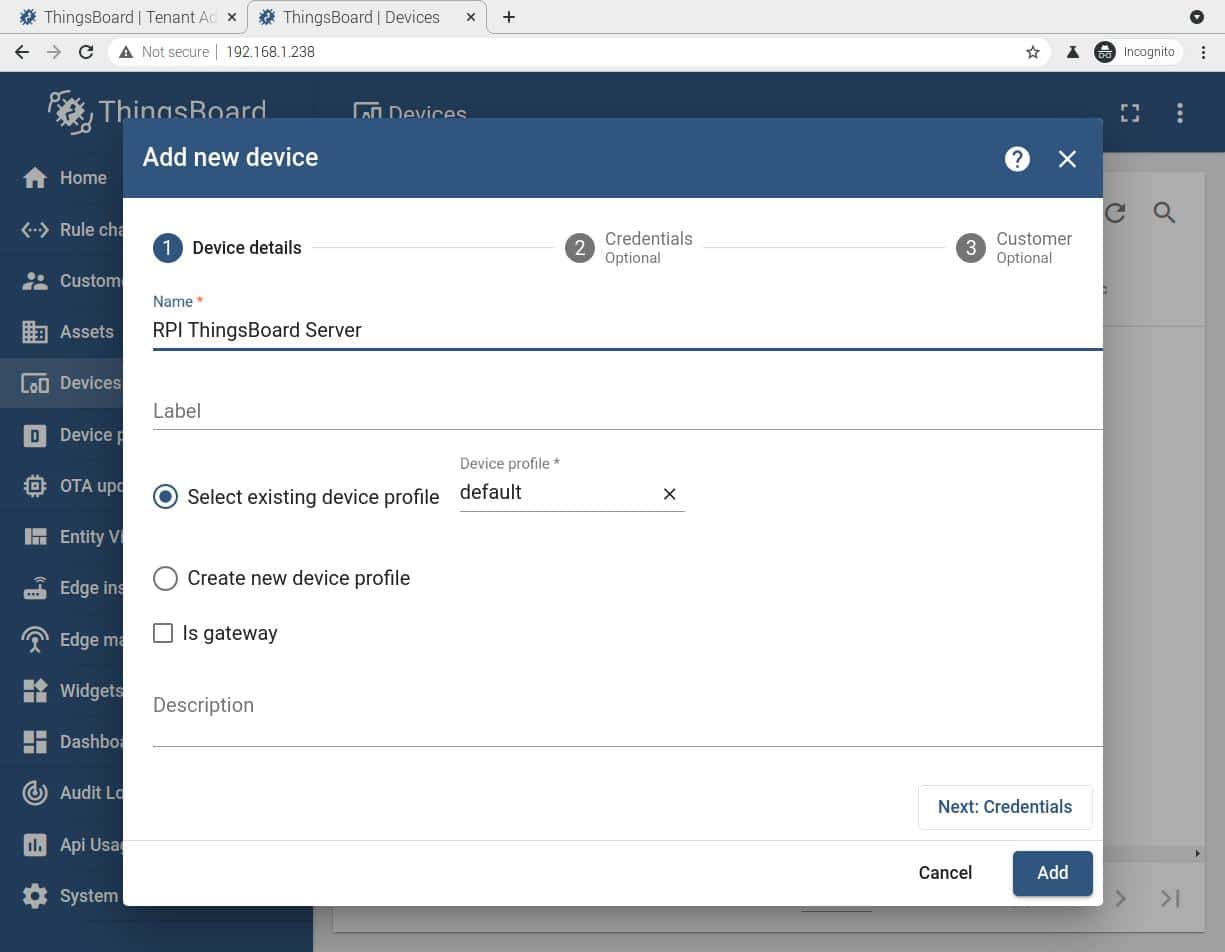
Fill in the name field something useful to identify the device you are adding (I used “RPI ThingsBoard Server”). You can leave all the other fields as default and directly click the “Add” button at bottom-right:
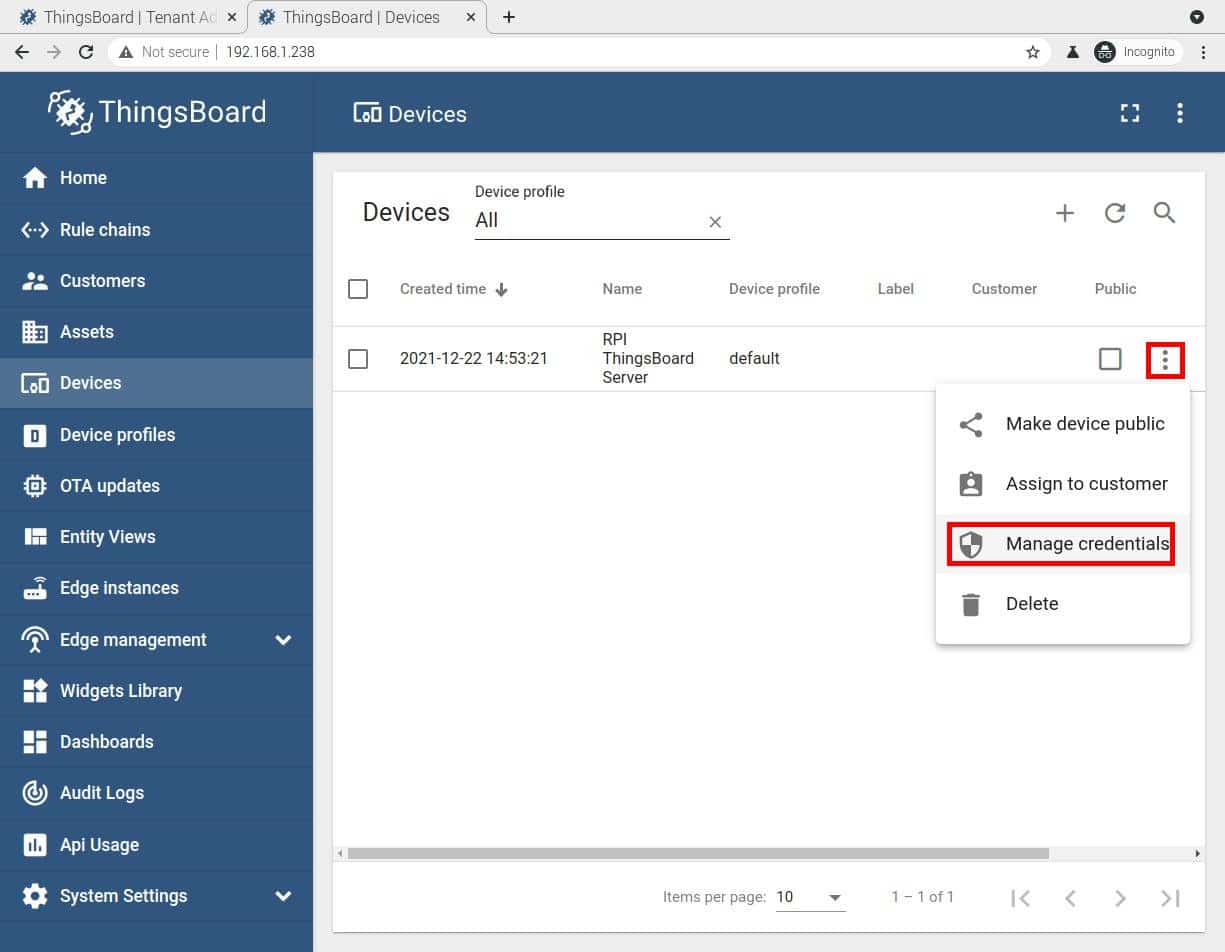
You will find now the first device available from the Devices list. Use the hamburger menu in the same row as our Raspberry PI device to open the sub-menu where you have to click on the “Manage credentials” link:
You will get the access token for the Raspberry PI device:
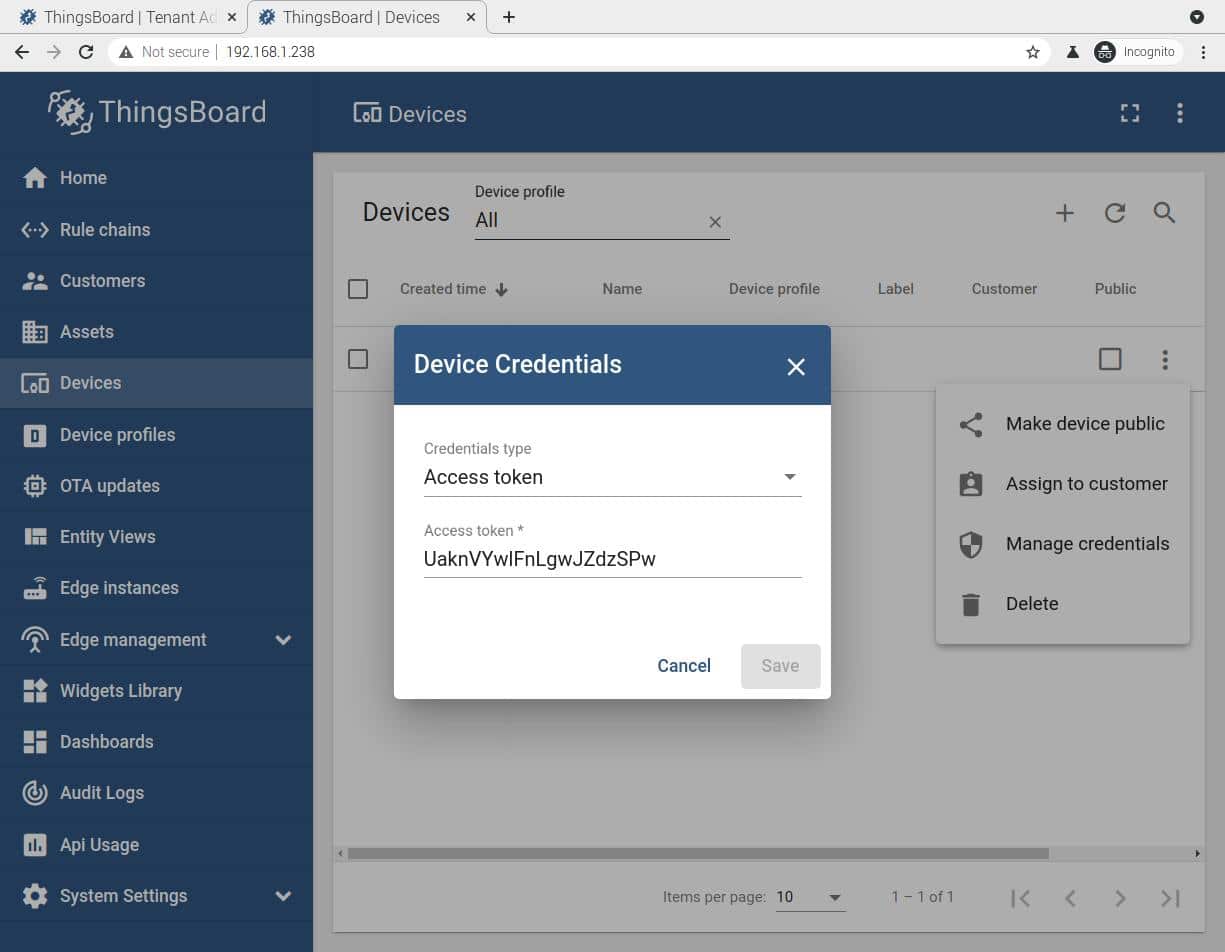
Copy it as we’ll need this string for the following steps.
You can now close the Device Credentials window by clicking the Cancel button.
Install and Test Mosquitto
Back to Raspberry PI terminal, please use the following command to install MQTT client:
sudo apt install mosquitto-clients -yTo test that MQTT communication is running correctly, we’ll send a message to ThingsBoard including a telemetry measure (manually set to value 25). From the terminal, please use the following command (please remember to use your token instead of mine, in red):
mosquitto_pub -d -q 1 -h "localhost" -p "1883" -t "v1/devices/me/telemetry" -u "UaknVYwlFnLgwJZdzSPw" -m {"CPU_temp":25}Note that the “CPU_temp” label can be whatever you want, but it must NOT include spaces inside the string. The following is the expected result:
pi@raspberrypi:~ $ mosquitto_pub -d -q 1 -h "localhost" -p "1883" -t "v1/devices/me/telemetry" -u "UaknVYwlFnLgwJZdzSPw" -m {"CPU_temp":25}
Client (null) sending CONNECT
Client (null) received CONNACK (0)
Client (null) sending PUBLISH (d0, q1, r0, m1, 'v1/devices/me/telemetry', ... (13 bytes))
Client (null) received PUBACK (Mid: 1, RC:0)
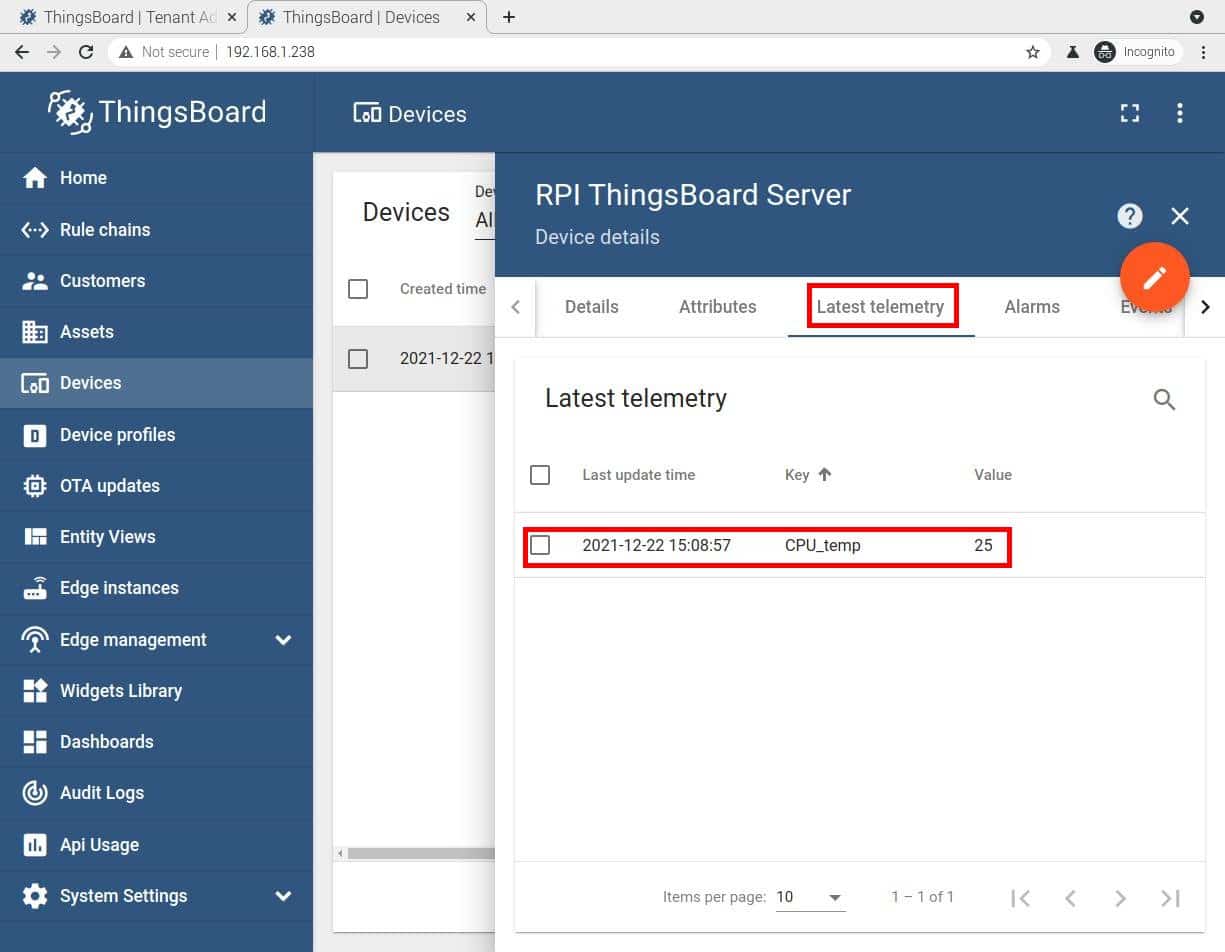
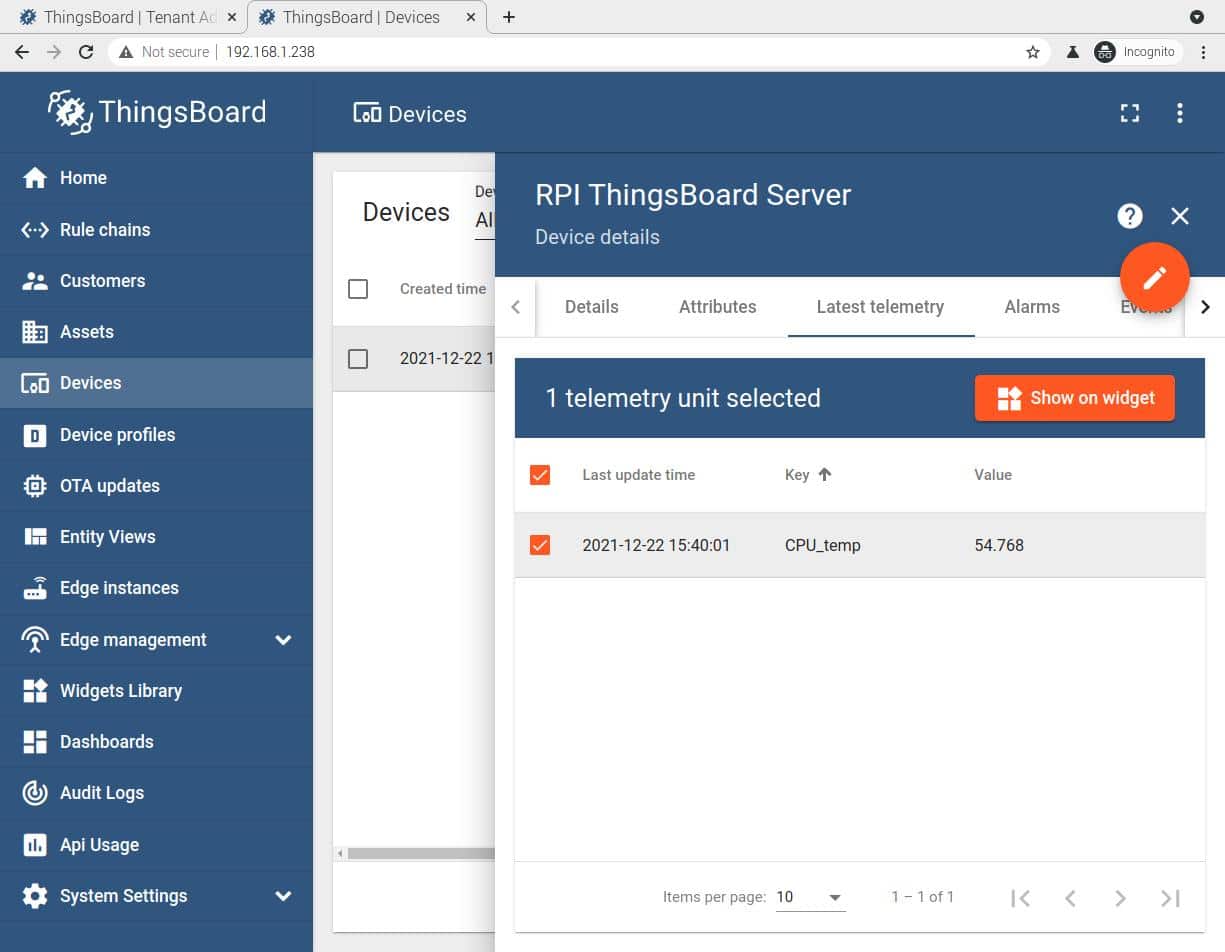
Client (null) sending DISCONNECTThis is a correct communication log. We can check that the value has been correctly received and registered from ThingsBoard by going back to “Devices” list in ThingsBoard dashboard, clicking (single left click with the mouse) on our Raspberry PI device in this list, and finally switching to “Latest Telemetry” tab. You will see the CPU_temp telemetry registration:
Create the Python Script
Create a python script named “get_CPUtemp.py”:
nano get_CPUtemp.pyAnd use the following content. Please remember, again, to use your token instead of red one:
from subprocess import Popen, PIPE
token="UaknVYwlFnLgwJZdzSPw"
host="localhost"
port="1883"

def console(cmd):
    p = Popen(cmd, shell=True, stdout=PIPE)
    out, err = p.communicate()
    return out.decode('ascii').strip()

param_name="CPU_temp"
param_cmd="cat /sys/class/thermal/thermal_zone0/temp | awk '{print $1/1000}'"

value=str(console(param_cmd))

publish='mosquitto_pub -d -q 1 -h "'+host+'" -p "'+port+'" -t "v1/devices/me/telemetry" -u "'+token+'" -m {"'+param_name+'":'+value+'}'
console(publish)
This script just defines a custom function named “console()” that keeps as input a string and executes that string on the host bash shell.
One of the ways to get CPU temperature on Raspberry PI is by running on shell the “cat /sys/class/thermal/thermal_zone0/temp” command. This results in a number that, divided by 1000, gives CPU temperature in degrees. But the cat result isn’t a real integer number, so piping the built-in awk function both converts it to floating and divides by 1000.
The publish variable stores the Mosquitto string to run in order to publish values. It is executed with the final “console(publish)” line.
Please note that you can customize this script by changing “param_name” with your favorite telemetry label and “param_cmd” with the shell command to be executed.
Test the script by running, from the terminal:
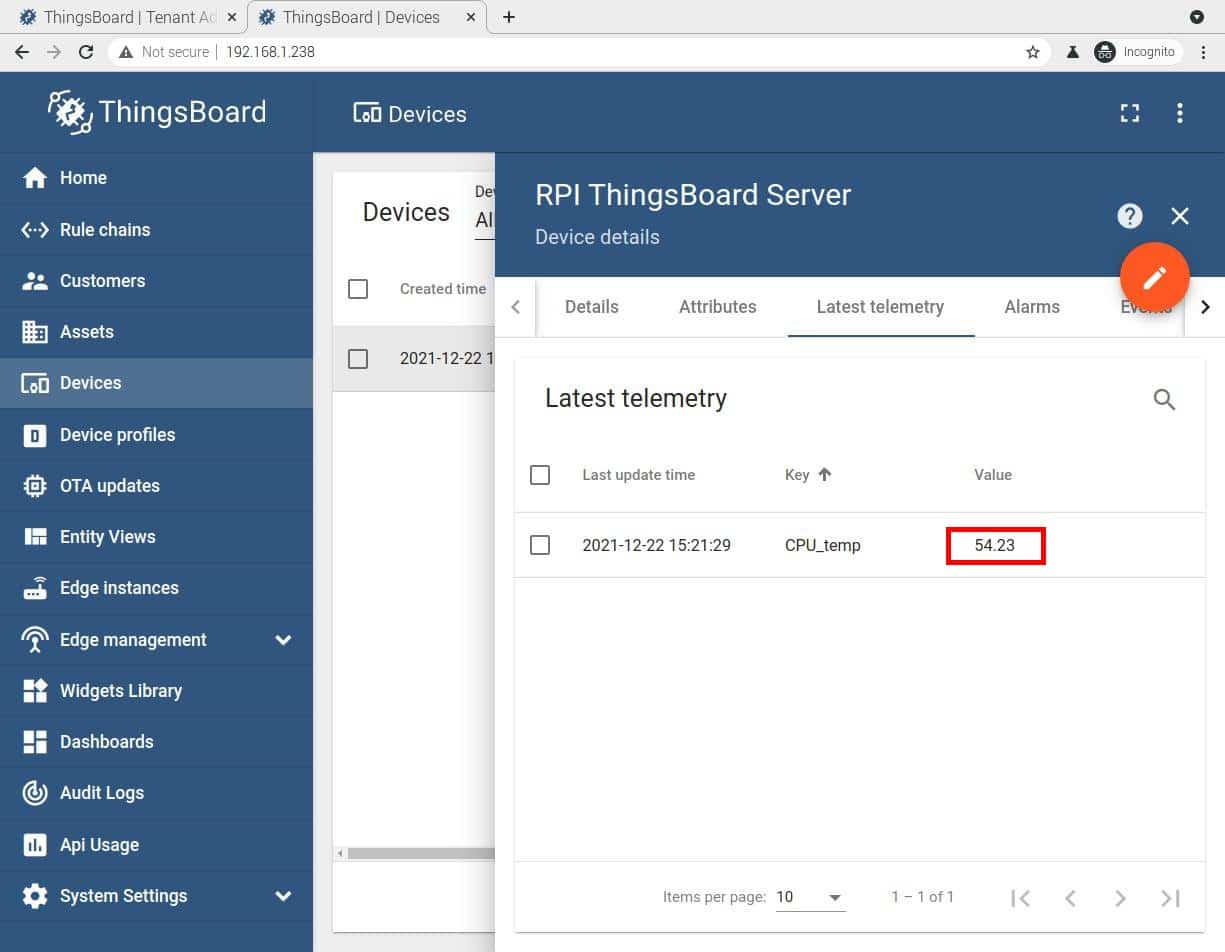
python3 get_CPUtemp.pyA new CPU_temp reading will be recorded in our ThingsBoard tenant, this time with a real CPU temperature value:
Set Telemetry Measures Periodic
For this task we’ll use the built-in cron service. From terminal, open the cron jobs configuration file with the following command:
crontab -ePlease note that these cron jobs are executed as root, so we’ll need to provide the full path to execute our script.
The shell will show an option list to choose your favorite text editor, press 1 to use nano as editor or select your preferred one. Append the following line, supposing that “get_CPUtemp.py” script is located in your pi user home folder:
* * * * * python3 /home/pi/get_CPUtemp.pyThis cron task will execute a CPU temperature measurement every minute and send it to our ThingsBoard tenant. Go back to Raspberry PI telemetry to check that “Last update time” changes every minute with a new temperature sample.
Create CPU Temperature Widget on a Dashboard
From ThingsBoard, please click on the CPU_temp telemetry. This will activate the “Show on widget” button:
Click it and select “Charts” on “Current Bundle” list menu. Here you can choose from different charts by switching with the left/right buttons on chart preview sides. I will use the “Timeseries Bar Chart”.
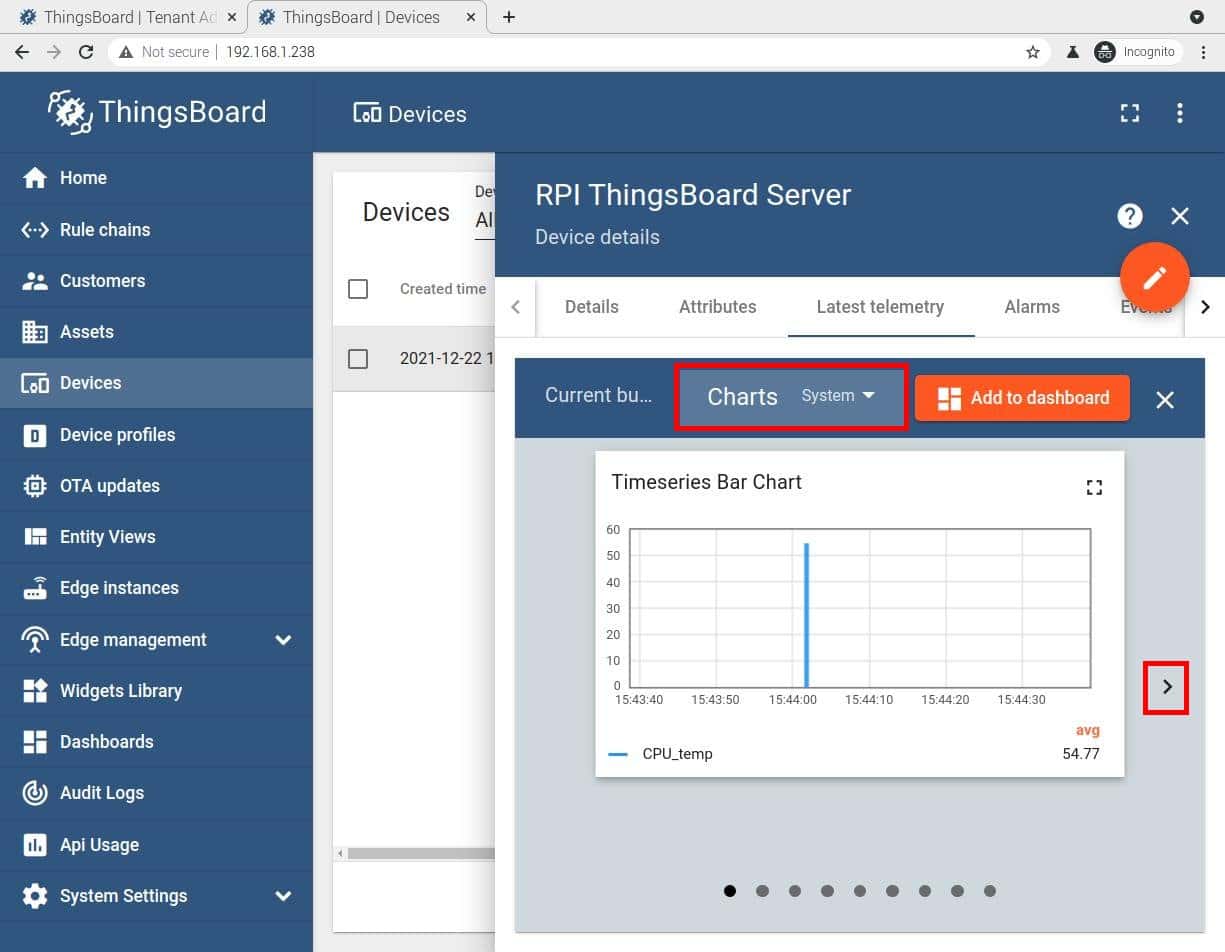
Once done, click the “Add to Dashboard” button. It will propose to add the widget to an existing dashboard or to directly create a new dashboard:
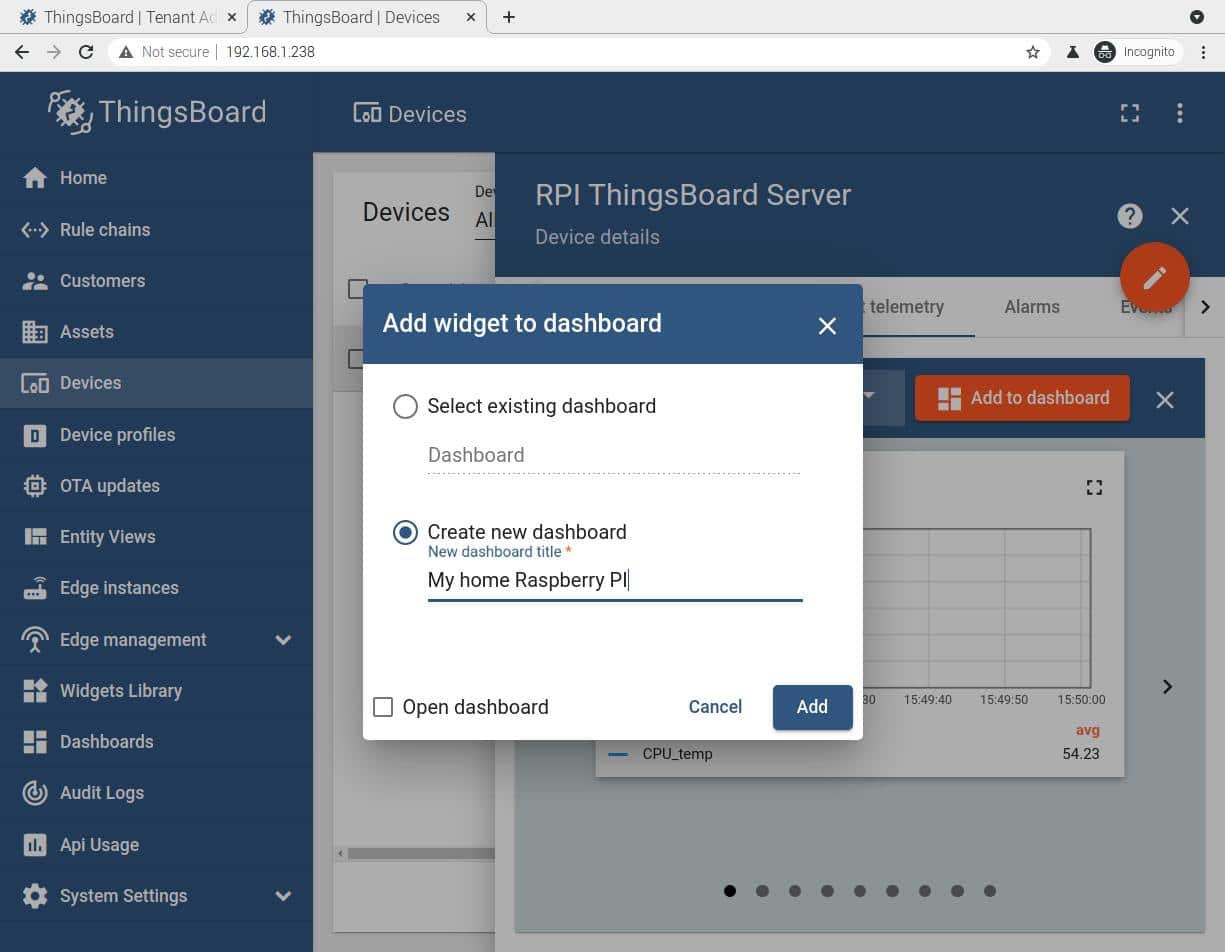
As our installation is new, select Create New dashboard, type your favorite name for it and click “Add”. The new widget is now added to a new space.
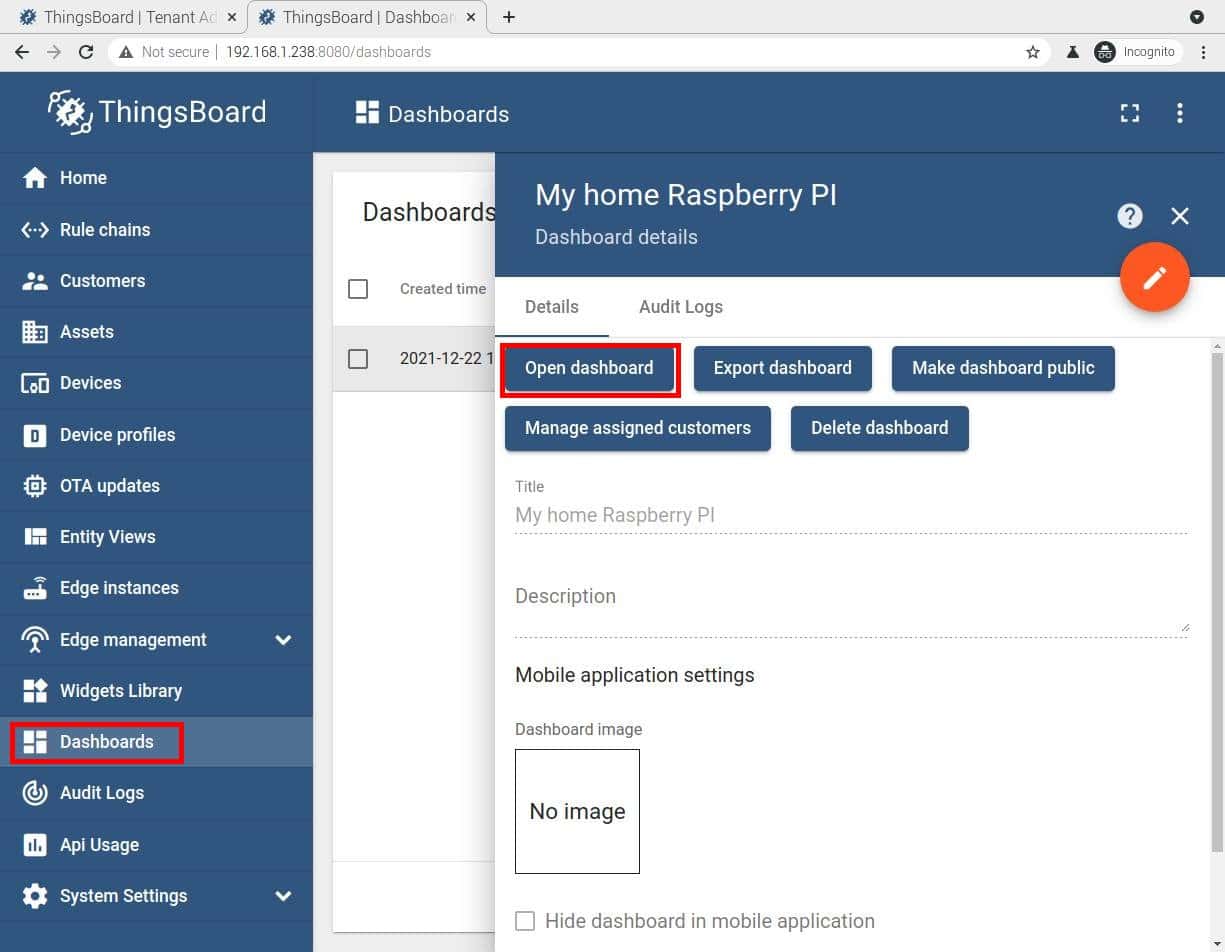
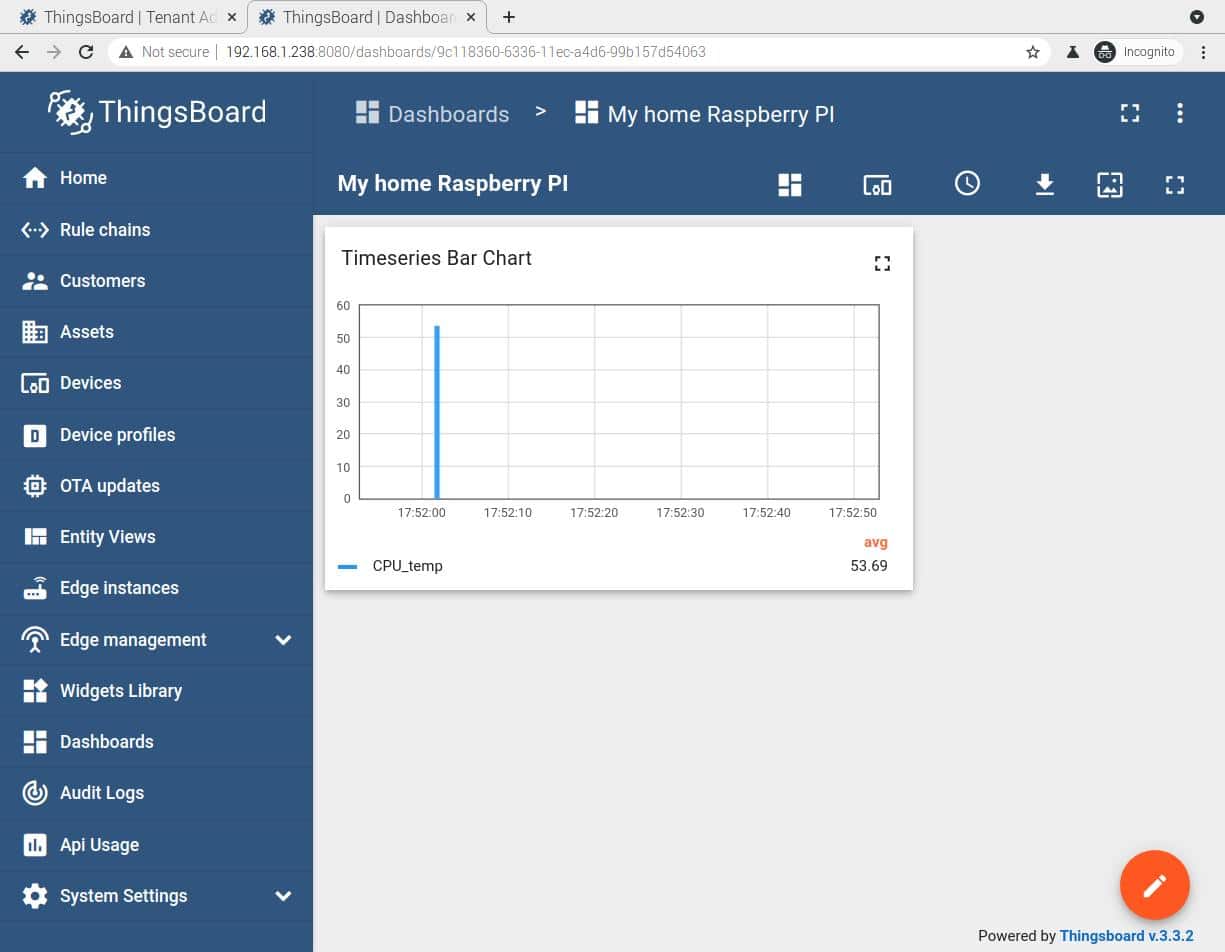
From the left side menu, go to Dashboards. This will list all your available dashboard spaces. If it is a new installation like in this tutorial, you will find only 1 available. Click it (“My home Raspberry PI” in my case) and then the button “Open Dashboard”:
You will find the widget with our timeseries bar chart:
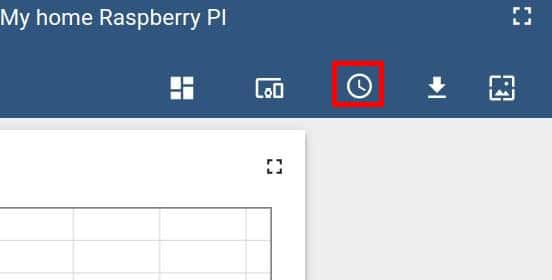
The pencil icon at the bottom-right side will enable you to move/resize all the widgets in your dashboard. Moreover, the clock icon will enable you to set the right timeframe to show:
By setting it to 5 hours I got the following:
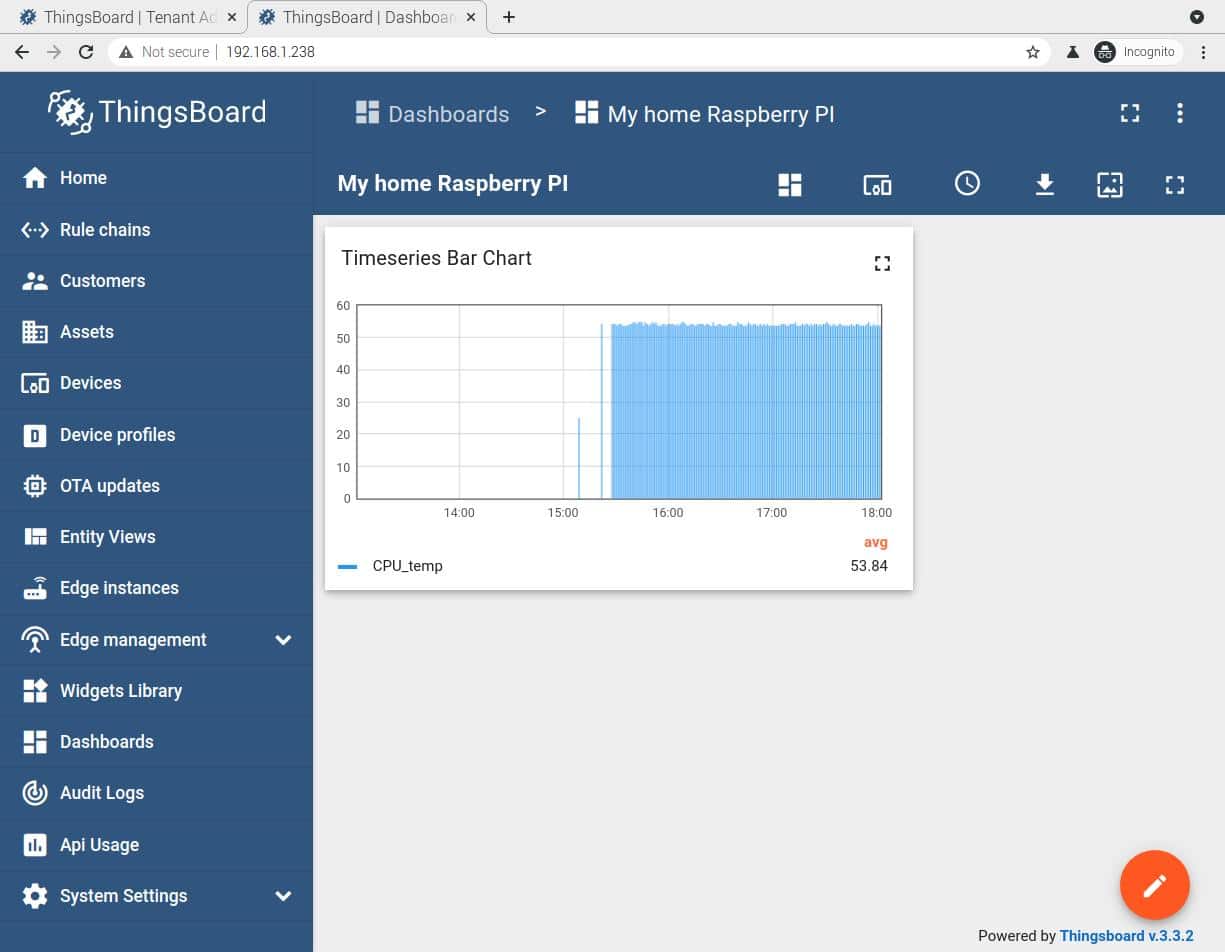
Enjoy!

Open source and Raspberry PI lover, writes tutorials for beginners since 2019. He's an ICT expert, with a strong experience in supporting medium to big companies and public administrations to manage their ICT infrastructures. He's supporting the Italian public administration in digital transformation projects.
![]()
![]()
![]()
![]()
![]()
![]()
![]()