Last Updated on 30th November 2025 by peppe8o
In this post, I’m going to show you how to install and use Dash on Raspberry PI.
Python has a great spreading in science because of its poweful modules to manage numbers and graph them. In some cases you may need to show these graphs outside of your Raspberry PI, without remoting your desktop or with a headless installation. Publishing Python results on web pages is achievable with Dash on Raspberry PI.
What is Dash
Dash is an open source python library to build and deploy data applications from a number of languages, the most common being python. It is based on Flask, but also uses Plotly to better manage graphical paths on web pages viewable from a remote computer or a mobile using a common web browser.
An alternative to Dash is Streamlit, which currently doesn’t work on Raspberry PI OS (32 bit) because of Pyarrows problems.
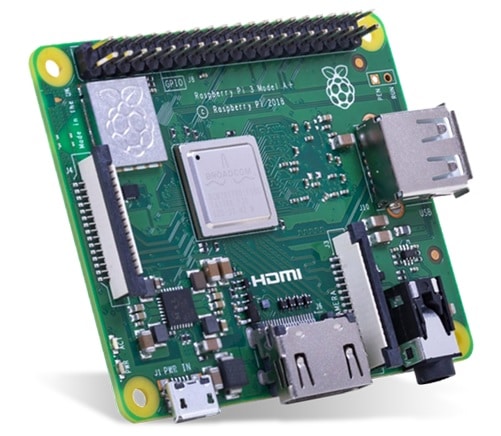
In this tutorial, I’m going to use a Raspberry PI 3 Model A+. But this guide will work with any Raspberry PI computer board having a network connection (excluding Raspberry PI Pico, which is a microcontroller).
What We Need
As usual, I suggest adding from now to your favourite e-commerce shopping cart all the needed hardware, so that at the end you will be able to evaluate overall costs and decide if to continue with the project or remove them from the shopping cart. So, hardware will be only:
- Raspberry PI 3 Model A+ (including proper power supply or using a smartphone micro usb charger with at least 3A) or newer Raspberry PI Board
- high speed micro SD card (at least 16 GB, at least class 10)
Check hardware prices with the following links:


Step-by-Step Procedure
Prepare Operating System and required packages
Start installing OS. You can both use Raspberry PI OS Lite (for a fast, headless installation) or Raspberry PI OS Desktop (in this case using its internal terminal). For low performance boards like Raspberry PI models Zero or A, I suggest the headless installation as it allows using all the computing capabilities to execute python code.
Make sure your OS is up to date. If not already done, please use the following command:
sudo apt update -y && sudo apt upgrade -yWe also need pip3. From terminal:
sudo apt install python3-pipInstall Dash
The official Dash installation procedure didn’t work for me. I think both because it resides on old python2 and the python3 packages from pip3 are giving errors not recognizing pandas installed, even if it was. So I’ve installed the main dependencies (Plotly and Pandas) from aptitude repositories and dash from pip3, thus having a working setup.
So, you will install both dash and dependencies with following terminal commands:
sudo apt install python3-plotly python3-pandas
pip3 install dash
During dash installation you will note some warnings: “The scripts xxx are installed in ‘/home/pi/.local/bin’ which is not on PATH.” To fix this use the following commands, which create a backup of your environment variable and then add the required path according to your user:
sudo cp /etc/environment /etc/environment.backup
sudo sed -i 's|PATH="|PATH="\/home\/'"$USER"'\/.local\/bin:|g' /etc/environment
Finally, reboot your Raspberry PI to make the path variable applied.
Example 1: Run a Demo Application
We’ll use the default demo application to make sure that Dash is working properly and to test it.
You can get a copy of this code from my download area with the following terminal command:
wget https://peppe8o.com/download/python/Dash/app.pyBefore running the app.py, let’s dig into what includes.
First of all, required modules are imported:
import dash
from dash import dcc, html
import plotly.express as px
import pandas as pd
Besides dash, we import also plotly (to create and manage graphs) and pandas (to manage data).
A new dash application is initialized:
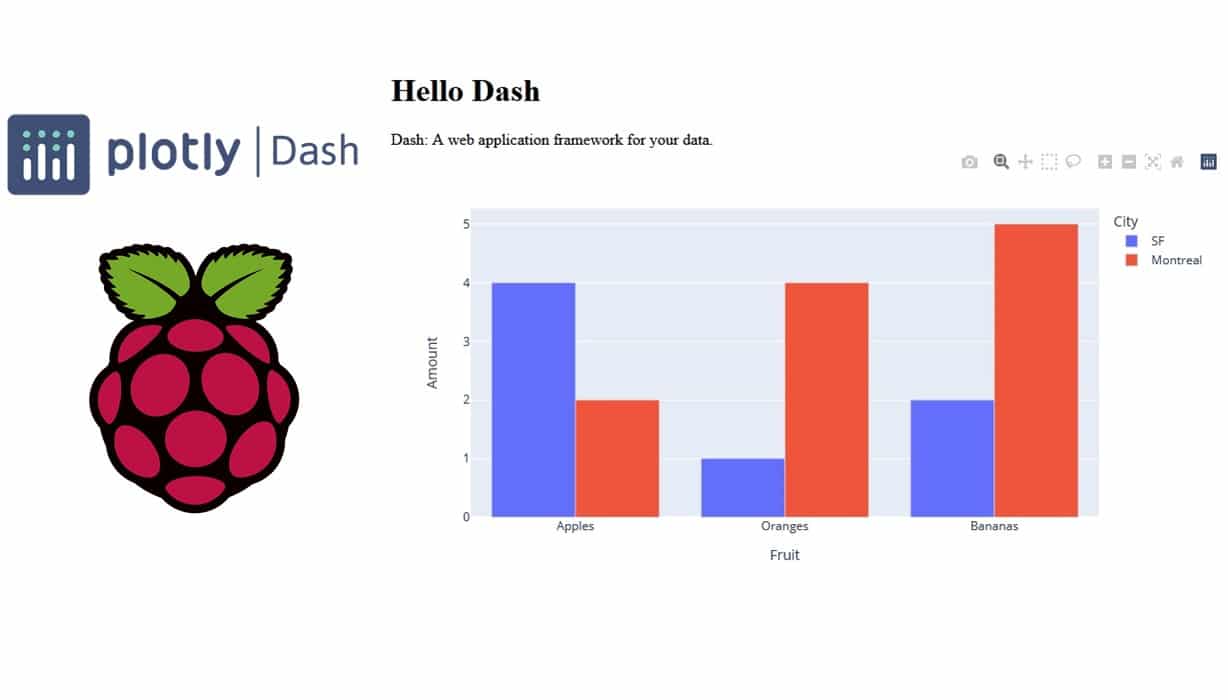
app = dash.Dash(__name__)A pandas data frame will include all our test data to show on our web graph:
df = pd.DataFrame({
    "Fruit": ["Apples", "Oranges", "Bananas", "Apples", "Oranges", "Bananas"],
    "Amount": [4, 1, 2, 2, 4, 5],
    "City": ["SF", "SF", "SF", "Montreal", "Montreal", "Montreal"]
})
With Plotly Express we create a new figure item, set to bar graph, having Fruits variable to X axis and the quantity to Y axis:
fig = px.bar(df, x="Fruit", y="Amount", color="City", barmode="group")The HTML code to show is set with the layout method from Dash. Here we can both set our custom heml tags and add plotly components as follows:
app.layout = html.Div(children=[
    html.H1(children='Hello Dash'),
    html.Div(children='''Dash: A web application framework for your data'''),
    dcc.Graph(
        id='example-graph',
        figure=fig
    )
])
Finally, the main program statement. Please note that, differently from original app.py code, I also added the host=’0.0.0.0′ parameter to make the web page available from remote devices instead of getting them only from local host. As we’ll see in next example, here we can also set a custom port to use, if different from default 8050:
if __name__ == '__main__':
    app.run(debug=True, host='0.0.0.0')
We can now run the script from our terminal with the following command:
python3 app.pyWe’ll note that the shell will warn as follows:
pi@raspberrypi:~ $ python3 app.py
Dash is running on http://0.0.0.0:8050/

 * Serving Flask app 'app' (lazy loading)
 * Environment: production
   WARNING: This is a development server. Do not use it in a production deployment.

   Use a production WSGI server instead.
 * Debug mode: on
It is a common warning from the flask backend which warn that a common production environment should have demonizing, monitoring and load balancing features that flask doesn’t implement by itself (https://flask.palletsprojects.com/en/1.1.x/tutorial/deploy/) and requires external programs. You also will see that keeping this app running will require your terminal to stay open. This problem can be solved, for example, by using packages able to demonize and monitor apps, like Gunicorn (as described in the final part of my flask tutorial).
Back to our app.py running, from a remote computer/mobile use your Raspberry PI’s IP Address and add 8050 port. For example, mine one has local IP 192.168.1.177 and the resulting URL for my local network is htp://192.168.1.177:8050. You will get the following:
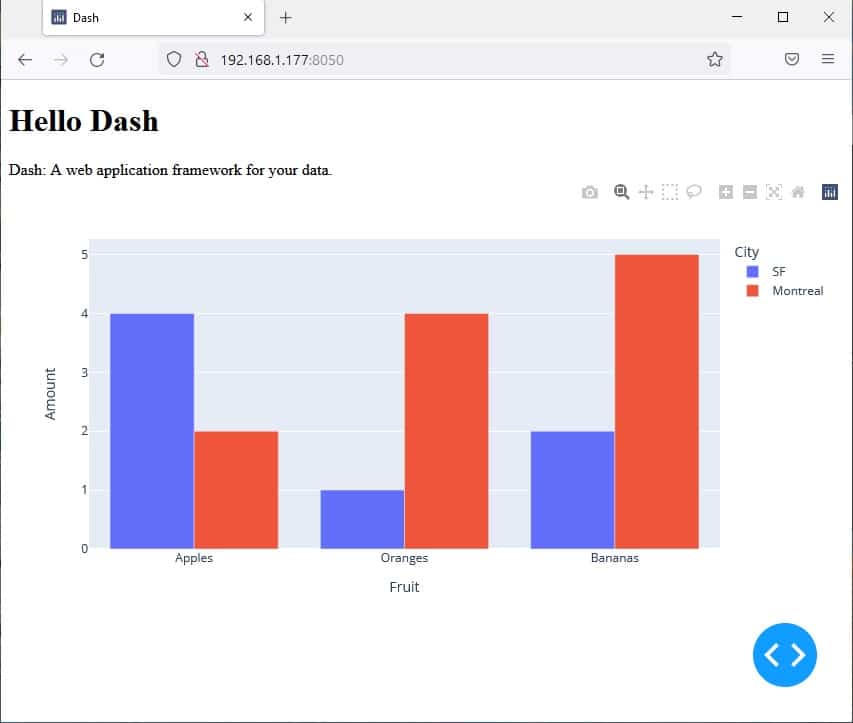
Use CTRL+C from terminal to stop the script execution.
Example 2: Custom CPU Temperature Monitoring for Raspberry PI
This example will display on a remote web browser our Raspberry PI internal temperature.
You can get the script in your Raspberry PI with the following terminal command:
wget https://peppe8o.com/download/python/Dash/dashTempApp.pyPlease let me describe what code lines mean before running the new script.
As in previous example (and as all python scripts), required libraries are imported:
import dash
from dash import dcc, html
from dash.dependencies import Input, Output
import plotly.graph_objs as go
from collections import deque
import re, subprocess
Please note that we also add deque (from collections) to manage data queues and simplify pushing data to our array which will store temperature samples.
Also re and subprocess libraries are imported in order to execute from python a local shell command in the server (Raspberry PI in our case), which will get the temperature value.
Then we define a function, called check_CPU_temp, which returns the temperature value from ” cat /sys/class/thermal/thermal_zone0/temp” command. You can also test this in your Raspberry PI terminal, getting the current CPU temperature (value has to be divided by 1000 and is in Celsius degrees).
def check_CPU_temp():
    temp = None
    err, msg = subprocess.getstatusoutput('cat /sys/class/thermal/thermal_zone0/temp')
    if not err:
        m = re.search(r'-?\d\.?\d*', msg)   # a solution with a  regex
        try:
            temp = float(m.group())/1000
        except ValueError: # catch only error needed
            pass
    return temp
X axis (which is a simple incremental value) and Y axis (temperature) are managed with two deque variables. Both cases are 100-values long array to show only last 100 values. You can customize this length according to your preferences. The first value for Y will be a first read of your CPU temperature:
X = deque(maxlen=100)
X.append(1)
Y = deque(maxlen=100)
Y.append(check_CPU_temp())
As in previous example, we initialize the dash object and define the HTML components. Also note the dcc.Interval: this sets the refresh rate to 1 second (interval = 1*1000, measured in milliseconds) and can be customized according to your needs:
app = dash.Dash(__name__)

app.layout = html.Div(children=[
    html.H1('RPI CPU Temperature'),
    html.Div('Example from peppe8o.com'),
    dcc.Graph(id='live-graph', animate=True),
    dcc.Interval(id="refresh", interval=1 * 1000, n_intervals=0)
    ]
)
The following callback method will give the rigger to update graph:
@app.callback(Output("live-graph", "figure"), [Input("refresh", "n_intervals")])Then we define what has to be done at each refresh: we add an incremental value to X-axis and a new temperature sample. Deque will manage the array by pushing the last value and removing the older one. The new data array is set to the graph and shown on the web page, with the x-axis and y-axis dynamically adapting to a range between their minimum a maximum value:
def update(n_intervals):
    X.append(X[-1]+1)
    Y.append(check_CPU_temp())
    data = go.Scatter(
            x=list(X),
            y=list(Y),
            name='RPI Temp',
            showlegend=True,
            mode= 'lines'
            )

    return {'data': [data],'layout' : go.Layout(xaxis=dict(range=[min(X),max(X)]),
                                                yaxis=dict(range=[min(Y),max(Y)]),)}
Finally, the main program statement, which also explicit the port to be used:
if __name__ == "__main__":
    app.run(debug=True, host='0.0.0.0', port='8050')
You can now run the script from your Raspberry PI terminal:
python3 dashTempApp.pyAnd reach the new app with the same URL as the previous example (http://192.168.1.177:8050 for my Raspberry PI in my local network). Our new result can be seen in the following YouTube video:
The only issue that I noted, is that when you move into different tabs on my browser the graph starts resetting axes at each refresh, even if showing correct data. A page refresh solves the issue and I think that this may be a minor bug between flask and modern web browsers. Hoping that Flask/Dash friends will correct it.
Enjoy Dash on Raspberry PI!

Open source and Raspberry PI lover, writes tutorials for beginners since 2019. He's an ICT expert, with a strong experience in supporting medium to big companies and public administrations to manage their ICT infrastructures. He's supporting the Italian public administration in digital transformation projects.
![]()
![]()
![]()
![]()
![]()
![]()
![]()