
Last Updated on 3rd March 2024 by peppe8o
In this tutorial, I’m going to show you how to install and use FastF1 with Rasberry PI computer boards.
For Formula 1 passionate like me, having a way to get the data that TV shows with drivers comparison would be fantastic to create my personal comparison between cars and driver’s performances. the Python FastF1 library with my Raspberry PI makes this possible with very few intuitive command lines.
What is Fast-F1
Fast-F1 gives you access to F1 lap timing, car telemetry and position, tyre data, weather data, the event schedule and session results. It uses Pandas, Numpy and Matplotlib, making it easy to create customized, interactive charts and enabling accurate data analysis and visualization.
FastF1 gets its data from two main sources:
- The official f1 data stream
- Ergast web API
FastF1 provides its event schedule for the 2018 season and all later seasons.
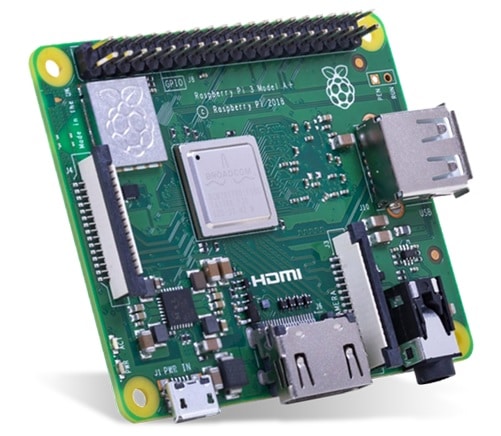
For this tutorial, I’ve made tests both with a Raspberry PI 3 Model A+ (with Raspberry PI OS Lite, for the shell-only examples) and a Raspberry PI 4 Model B (with Raspberry PI OS Desktop, for the charts tests).
What We Need
As usual, I suggest adding from now to your favourite e-commerce shopping cart all the needed hardware, so that at the end you will be able to evaluate overall costs and decide if to continue with the project or remove them from the shopping cart. So, hardware will be only:
- Raspberry PI 3 Model A+ (including proper power supply or using a smartphone micro USB charger with at least 3A) or newer Raspberry PI Board
- high speed micro SD card (at least 16 GB, at least class 10)
Step-by-Step Procedure
Prepare Operating System
Start preparing your OS. Please note that to use the interactive charts you will need the Raspberry PI OS Desktop, so requiring also a keyboard, mouse and monitor. If you need only the data results, you can work also with Raspberry PI OS Lite.
Make your OS up to date. From the terminal, please use the following command:
sudo apt update -y && sudo apt upgrade -yInstall FastF1 in Raspberry PI
In order to install FastF1, we need to use pip3. The commands will be the following:
sudo apt install python3-pip -yWe also need to create e new virtual environment and enter here:
python3 -m venv --system-site-packages my_project
source ./my_project/bin/activate
You can check that you entered the new virtual environment as your shell will show you the environment name:
(my_project) pi@raspberrypi:~ $Now, we can install fastf1:
pip3 install fastf1Finally, please create a cache folder that will be used later in examples to make queries faster:
mkdir ff1cachePlease note that this command creates the caching folder in your user home. In this tutorial I’m using the “pi” user, so having “/home/pi/ff1cache” string as the absolute path for caching. If you have a different user, you must set this path according to your user (changing the “pi” in the string).
That’s all. Fastf1 is now installed and ready to be used, as seen in the following examples.
FastF1 Main Concepts
Before going to examples. let us see a few main FastF1 concepts.
Caching
Caching should almost always be enabled to speed up the runtime of your scripts and to prevent exceeding the rate limit of API servers. FastF1 will print an annoyingly obnoxious warning message if you do not enable caching.
The following class-level functions are used to setup, enable and (temporarily) disable caching:
- fastf1.Cache.enable_cache(cache_folder) -> Enables the API cache.
- fastf1.Cache.clear_cache(cache_folder[, deep]) -> Clear all cached data.
- fastf1.Cache.disabled() -> Returns a context manager object that creates a context within which the cache is temporarily disabled.
- fastf1.Cache.set_disabled() -> Disable the cache while keeping the configuration intact.
- fastf1.Cache.set_enabled() -> Enable the cache after it has been disabled with set_disabled().
Fastf1 main objects
Fastf1 has 2 main objects:
- Event -> You can think of an event as a complete GP (with all the practices, qualifying and race). Also, each pre-season tests are managed as events
- Session -> This is a single round inside an event (that is each of ‘Practice 1’, ‘Practice 2’, ‘Practice 3’, ‘Sprint Qualifying’, ‘Qualifying’ or ‘Race’)
You can call events and sessions with one of the following:
- fastf1.get_session(year, gp[, identifier, …]) -> Create a Session object based on year, event name and session identifier.
- fastf1.get_testing_session(year, …) -> Create a Session object for testing sessions based on year, test event number and session number.
- fastf1.get_event(year, gp, *[, force_ergast]) -> Create an Event object for a specific season and gp.
- fastf1.get_testing_session(year, …) -> Create a Session object for testing sessions based on year, test event number and session number.
- fastf1.get_event_schedule(year, *[, …]) -> Create an EventSchedule object for a specific season.
With the last function, you will get the complete calendar for a specific season.
Session identifiers
To get specific session data, we’ll have to call it by its identifier (besides the event year and GP name/number). FastF1 allows calling a session with one of the following alternatives:
- session name abbreviation: ‘FP1’, ‘FP2’, ‘FP3’, ‘Q’, ‘SQ’, ‘R’
- full session name: ‘Practice 1’, ‘Practice 2’, ‘Practice 3’, ‘Sprint Qualifying’, ‘Qualifying’, ‘Race’ (the name is case-insensitive)
- number of the session: 1, 2, 3, 4, 5
Reducing Columns for Output
Fastf1 gives results with a lot of columns. As it uses Pandas, you can get better outputs with the loc function:
.loc[ rows_ref , columns_ref ]
which lets you choose what rows and columns to show. For each reference (both rows and columns), you can set it to show:
- a range: that is identified by simply putting the first value to show, the colon symbol and the final value to show
- a list: is a sequence of columns labels or indexes to show
- all the data: is obtained by simply putting the colon symbol
The list of available columns can be obtained from the “.columns” property available for quite every fastf1 object.
Please let me give you an example. Once session data are loaded, the session result object (that we’ll see in the following examples) has the following columns:
>>> session.results.columns
Index(['DriverNumber', 'BroadcastName', 'Abbreviation', 'TeamName',
       'TeamColor', 'FirstName', 'LastName', 'FullName', 'Position',
       'GridPosition', 'Q1', 'Q2', 'Q3', 'Time', 'Status', 'Points'],
      dtype='object')
In this case, you can show all the rows with only part of its columns with the following line:
session.results.loc[:, ['Position', 'FullName', 'TeamName','Q1','Q2','Q3']]FastF1 Examples
In this tutorial part, I’ll show you how to use fastf1 with your Raspberry PI. You can use it within a Python script or in the interactive python3 shell. The main difference comes in printing the data tables:
- from the python3 interactive shell, you can directly issue the object name
- from a python3 script, you will need to use the print() function
In both cases, you will need to start by importing the fastf1 library and enabling the cache (the latter will strongly improve the performance of your scripts once the data has been loaded the first time).
From the terminal, please open a python3 shell with the following command and press RETURN:
python3Now import the fastf1 library and enable cache (please check the cache path according to your cache folder position):
import fastf1
fastf1.Cache.enable_cache("/home/pi/ff1cache")
Example 1: Getting the F1 season calendar
We can get the season calendar for a specified year with the following command (where 2022 is the year I selected):
schedule = fastf1.get_event_schedule(2022)Now you can show the calendar for 2022 by calling the schedule variable just created:
scheduleWith the following result:
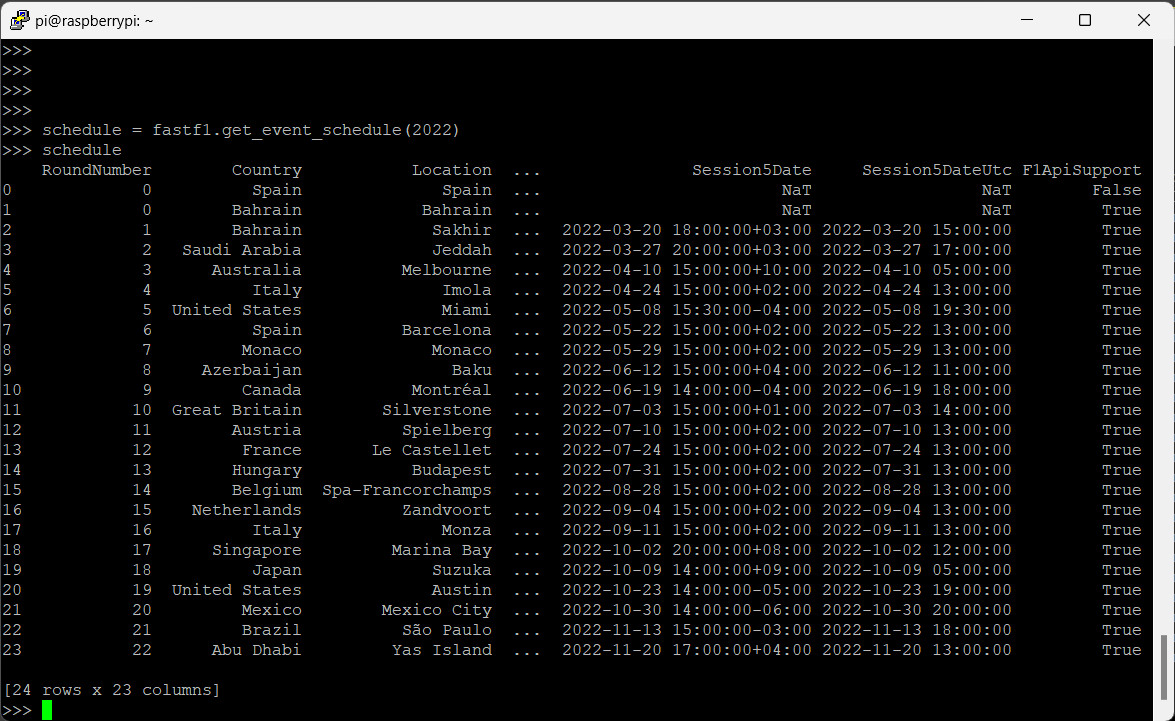
From the above output, you can see a column with a “…” (3 points) symbol. This means that more columns are available and have been hidden to make the output printable on your display. Moreover, after the list we’ll see the rows and columns count that confirms this:
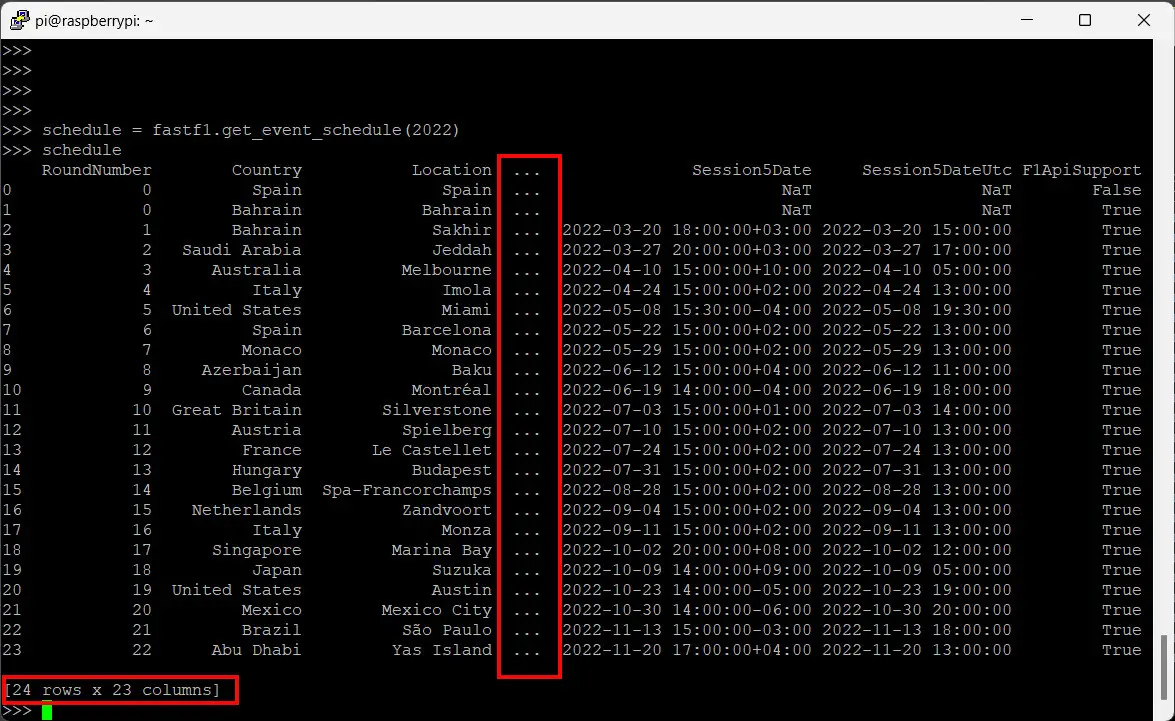
Let’s see all the available columns for the schedule object with the “schedule.columns” command:
>>> schedule.columns
Index(['RoundNumber', 'Country', 'Location', 'OfficialEventName', 'EventDate',
       'EventName', 'EventFormat', 'Session1', 'Session1Date',
       'Session1DateUtc', 'Session2', 'Session2Date', 'Session2DateUtc',
       'Session3', 'Session3Date', 'Session3DateUtc', 'Session4',
       'Session4Date', 'Session4DateUtc', 'Session5', 'Session5Date',
       'Session5DateUtc', 'F1ApiSupport'],
      dtype='object')
Please note that the session numbers match the order already explained in the related paragraph.
As said, we can fit the output to our needs by using the loc[] function. For example. we can get a simplified table by selecting all the rows but only part of the columns and showing only the race :
schedule.loc[:,['Country', 'Location', 'OfficialEventName', 'Session5Date']]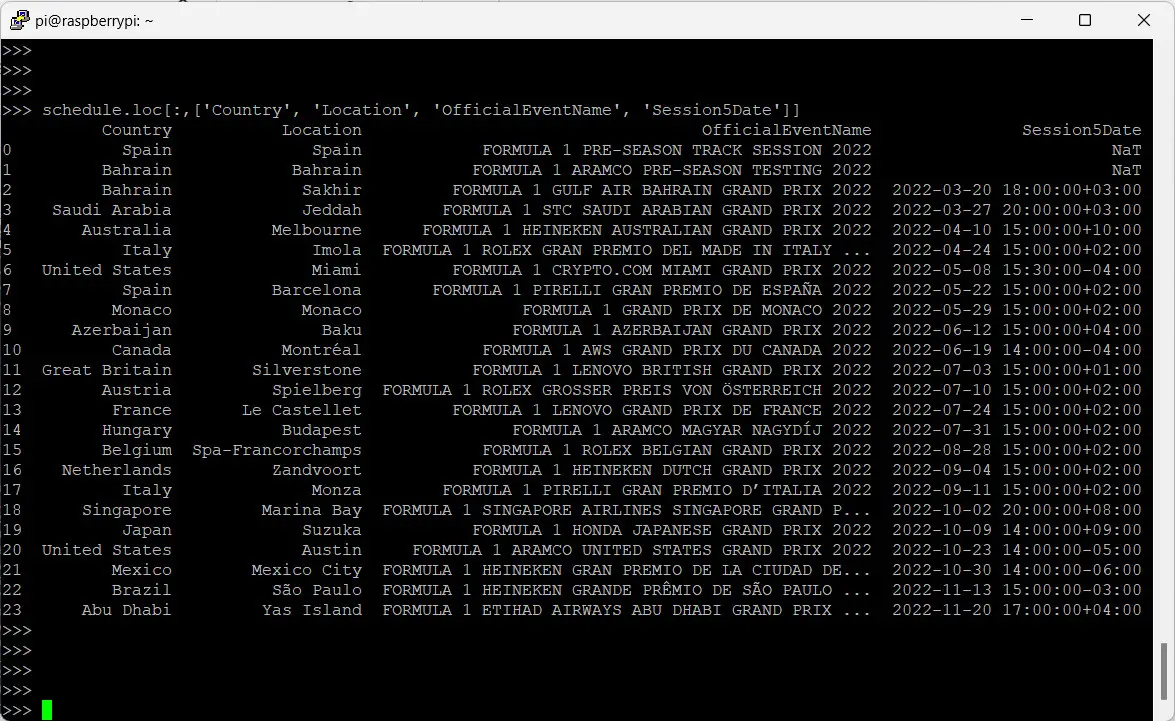
The resulting python3 script will be the following:
import fastf1
fastf1.Cache.enable_cache("/home/pi/ff1cache")

schedule = fastf1.get_event_schedule(2022)
print(schedule.loc[:,['Country', 'Location', 'OfficialEventName', 'Session5Date']])
While the single events give detailed info about the round organization, the session data are the most interesting part of fastf1. For this reason, in the following examples, we’ll be focused on sessions.
Example 2: getting Session Results
After importing the fastf1 library and enabling the cache, let’s set a session call and load its data:
session = fastf1.get_session(2022,3,'Q')
session.load()
Please note that during the loading of some sessions you could have some warnings about the missing data for some laps or telemetry, similar to the following:
api WARNING Driver 241: Position data is incomplete!This is caused by some data missing from the official channels for several possible reasons (for example a lap not finished for an incident or for technical issues). Anyway, these cases do not affect the good results that the library provides.
As you can see, we have called the session by ID. Please note that official sessions have an ID that doesn’t include the pre-season sessions. A way to check it is by verifying the parent event:
session.event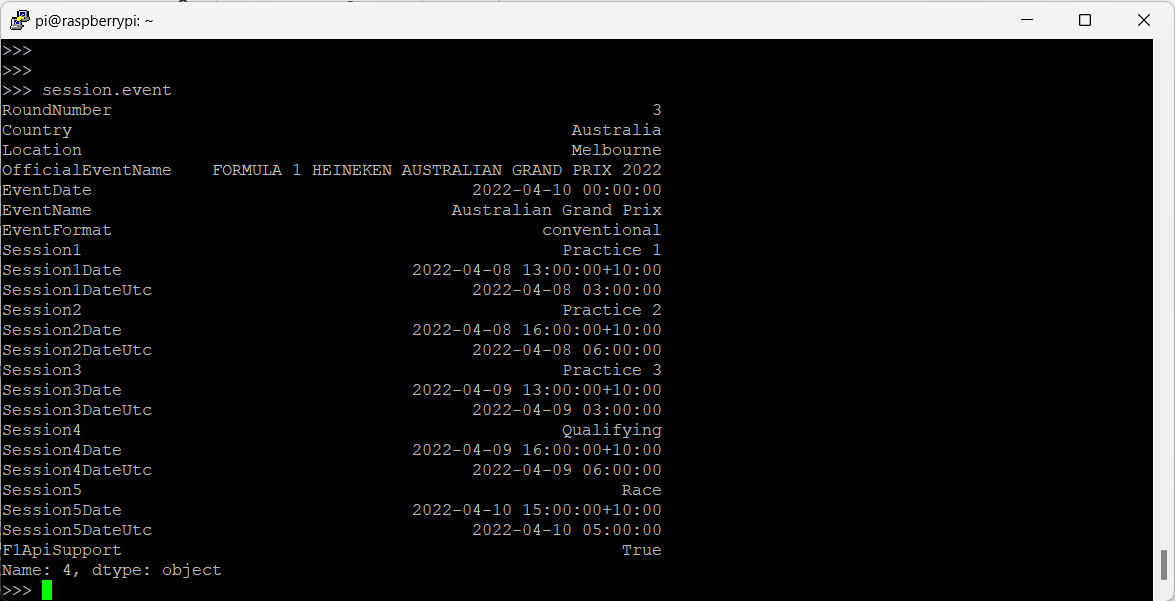
or calling a specific record from these data:
>>> session.event['OfficialEventName']
'FORMULA 1 HEINEKEN AUSTRALIAN GRAND PRIX 2022'
Now, we can get the session results:
session.results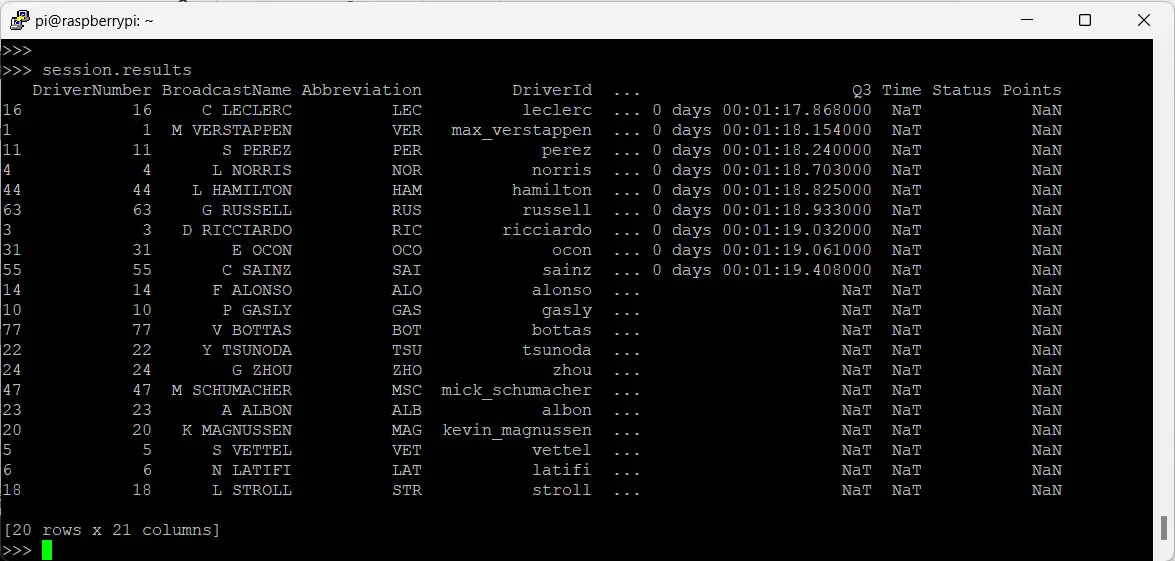
Again, let’s get a simplified view of available columns:
>>> session.results.columns
Index(['DriverNumber', 'BroadcastName', 'Abbreviation', 'DriverId', 'TeamName',
       'TeamColor', 'TeamId', 'FirstName', 'LastName', 'FullName',
       'HeadshotUrl', 'CountryCode', 'Position', 'ClassifiedPosition',
       'GridPosition', 'Q1', 'Q2', 'Q3', 'Time', 'Status', 'Points'],
      dtype='object')
With the following command:
session.results.loc[:,['Position', 'Abbreviation', 'TeamName', 'Q1', 'Q2', 'Q3']]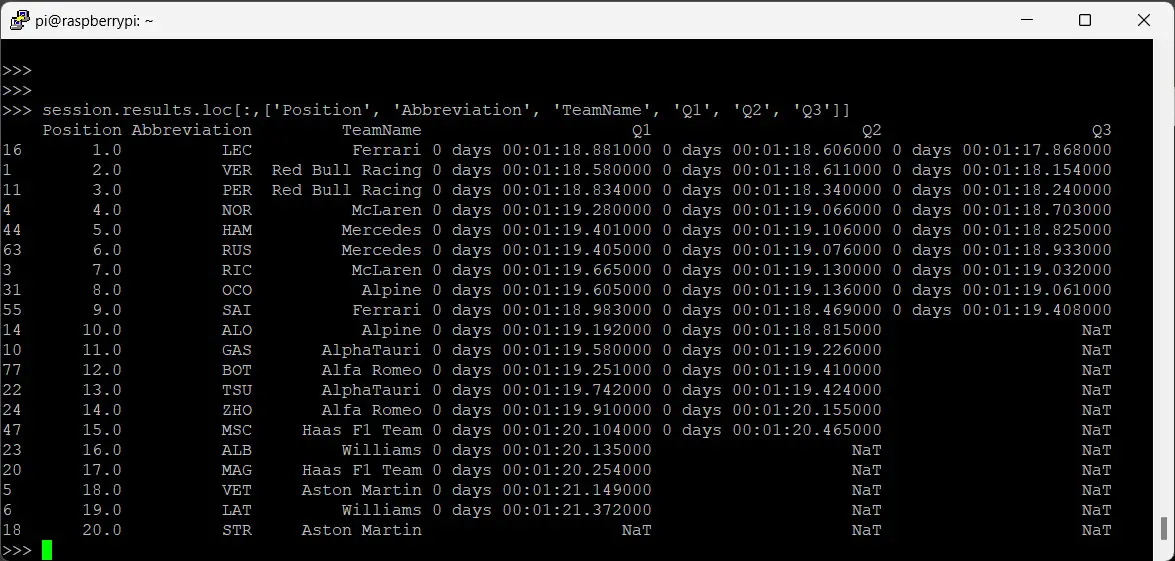
The following will be the related python3 script:
import fastf1
fastf1.Cache.enable_cache("/home/pi/ff1cache")

session = fastf1.get_session(2022,3,'Q')
session.load()
print(session.results.loc[:,['Position', 'Abbreviation', 'TeamName', 'Q1', 'Q2', 'Q3']])
Example 3: Driver Performances
Let’s analyze the performance of a specific driver in the session. We’ll use the same session already set and loaded. Moreover, we’ll analyze data for LeClerc. We’ll get the Ferrari driver laps in the selected session with the following command:
lec = session.laps.pick_driver('LEC')Showing these data by calling the “lec” variable:
lec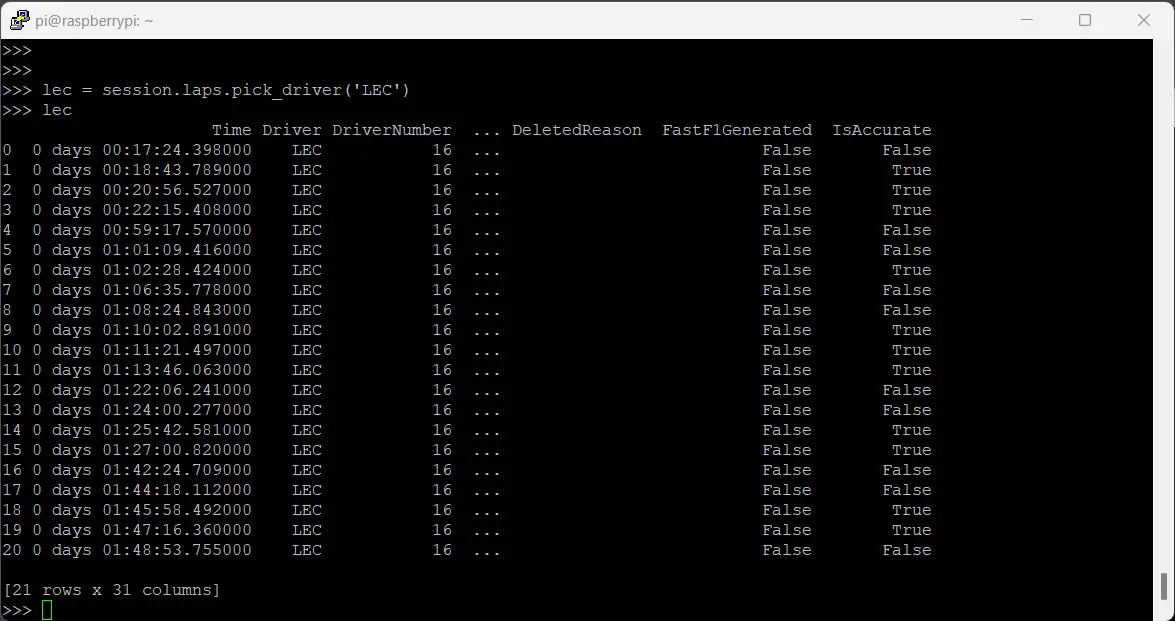
As you can see, rows are tagged with an “IsAccurate” boolean column. According to the official documentation, “if True the lap has passed a basic accuracy check for timing data. This does not guarantee accuracy but laps marked as inaccurate need to be handled with caution. They might contain errors which can not be spotted easily.“
A better visualization:
lec.loc[:,['Driver', 'Team', 'LapTime', 'LapNumber', 'Stint', 'Sector1Time', 'Sector2Time', 'Sector3Time', 'Compound', 'TyreLife']]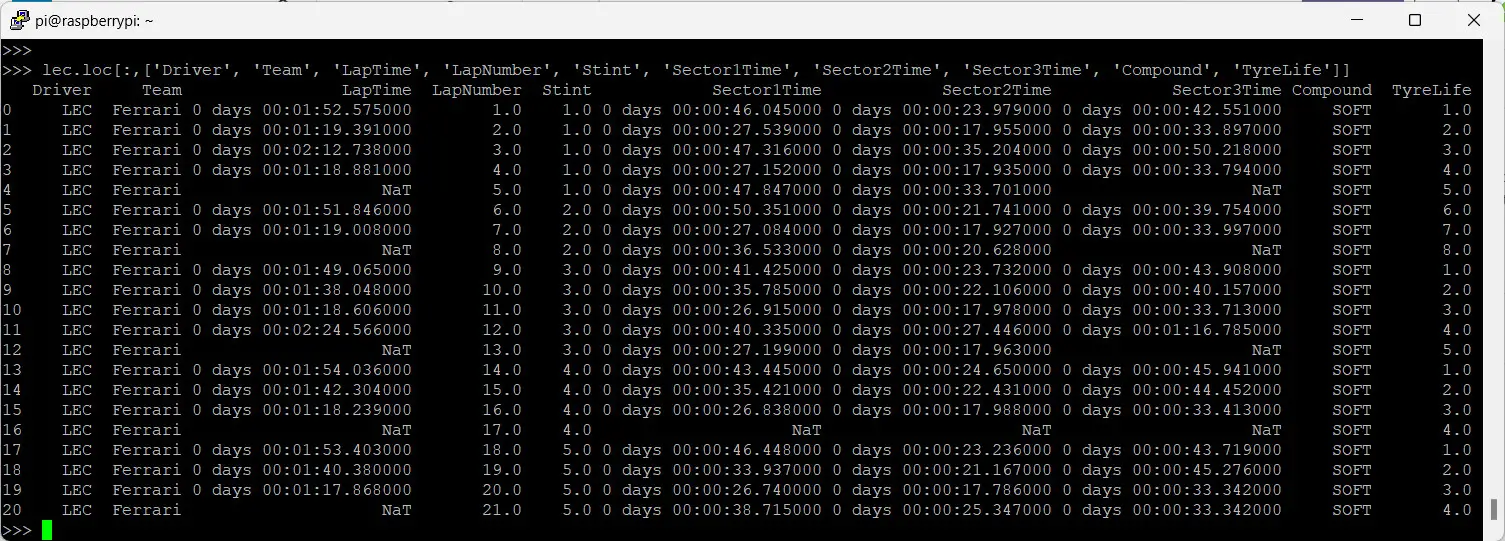
From these laps, you can get the fastest one with the pick_fastest() attribute:
lec.pick_fastest()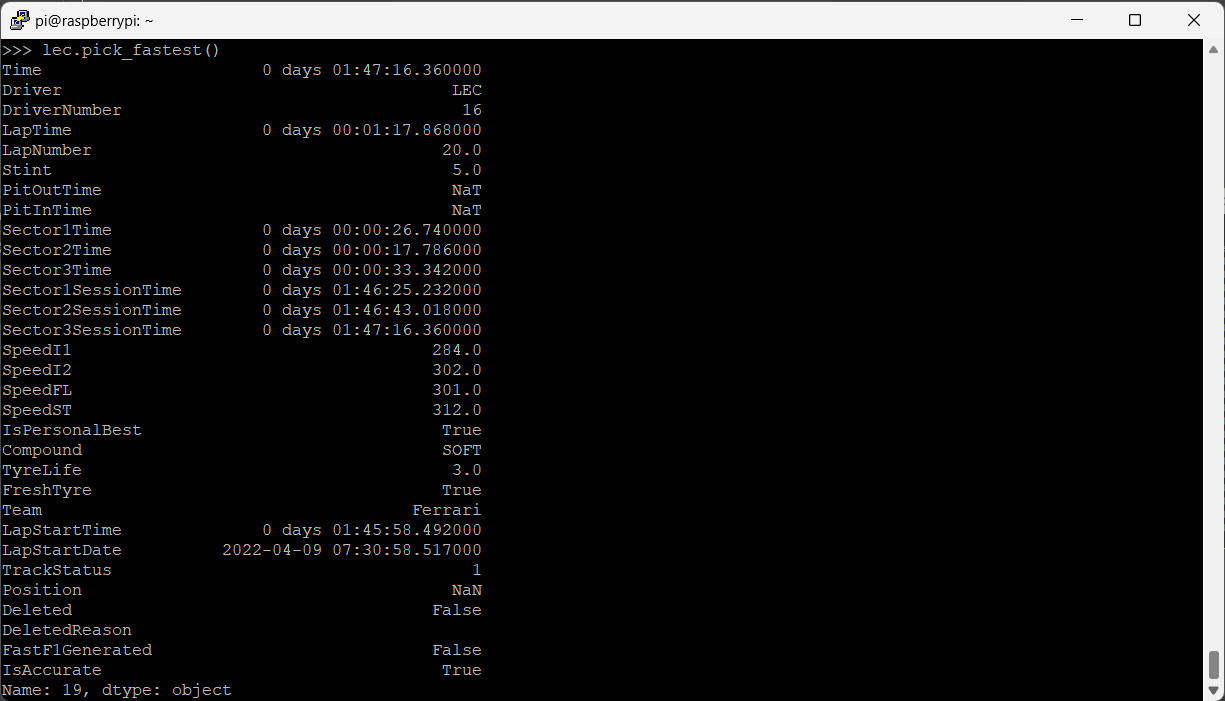
Finally, the related python3 script:
import fastf1
fastf1.Cache.enable_cache("/home/pi/ff1cache")
session = fastf1.get_session(2022,3,'Q')
session.load()
lec = session.laps.pick_driver('LEC')
print(lec.loc[:,['Driver', 'Team', 'LapTime', 'LapNumber', 'Stint', 'Sector1Time', 'Sector2Time', 'Sector3Time', 'Compound', 'TyreLife']])
print("Fastest:")
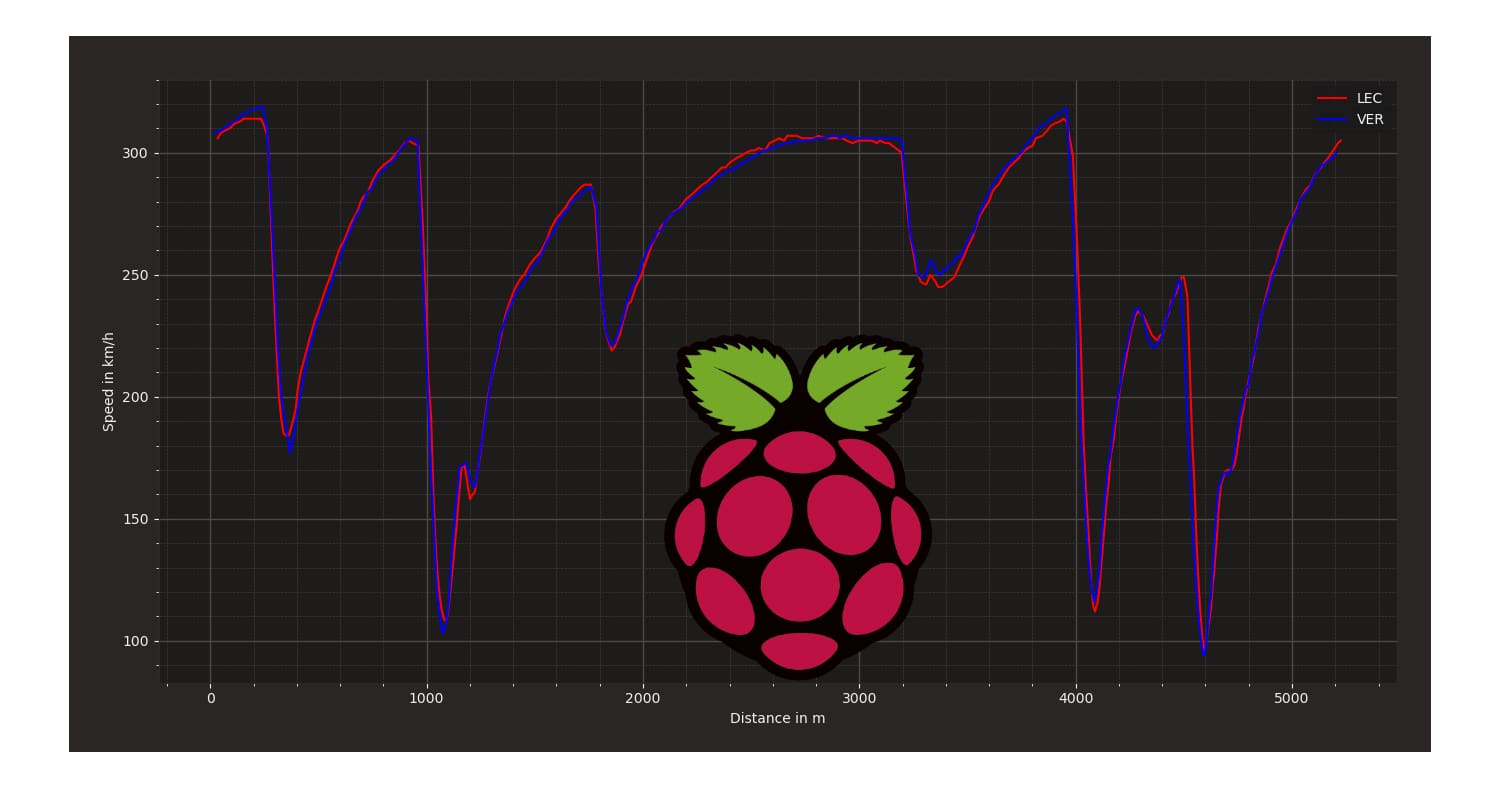
print(lec.pick_fastest())Example 4: Compare Driver’s Performances by Overlaying Speed Traces of Two Laps
Fastf1 is capable of generating amazing interactive graphs to compare performances between drivers, like the ones you can see on TV. With Fastf1 installed on an OS having a Desktop environment (like Raspberry PI OS Desktop), you can get these graphs shown directly on your display and you can customize the info to show.
Data will be plotted by the matplotlib already installed with the fastf1 library. The python3 script to do the job is the following one.
import matplotlib.pyplot as plt
import fastf1.plotting

fastf1.Cache.enable_cache('/home/pi/ff1cache')  # replace with your cache directory

# set session
year=2022
gp=3
ses='Q'

# set drivers abbreviated name
drv_1='LEC'
drv_2='VER'

# enable some matplotlib patches for plotting timedelta values and load
# FastF1's default color scheme
fastf1.plotting.setup_mpl()

# load a session and its telemetry data
session = fastf1.get_session(year, gp, ses)
session.load()

drv_1_lap = session.laps.pick_driver(drv_1).pick_fastest()
drv_2_lap = session.laps.pick_driver(drv_2).pick_fastest()

drv_1_tel = drv_1_lap.get_car_data().add_distance()
drv_2_tel = drv_2_lap.get_car_data().add_distance()

fig, ax = plt.subplots()
ax.plot(drv_1_tel['Distance'], drv_1_tel['Speed'], color='red', label=drv_1)
ax.plot(drv_2_tel['Distance'], drv_2_tel['Speed'], color='blue', label=drv_2)

ax.set_xlabel('Distance in m')
ax.set_ylabel('Speed in km/h')

ax.legend()
plt.suptitle(f"Fastest Lap Comparison \n "
             f"{session.event['EventName']} {session.event.year} Qualifying")

plt.show()
A detailed explanation of this script can be found at Fast-F1 examples_gallery plot_speed_traces, where I’ve only changed some lines to make the script simpler to manage with variables in the first part. The following is the interactive window that will pop out on your screen:
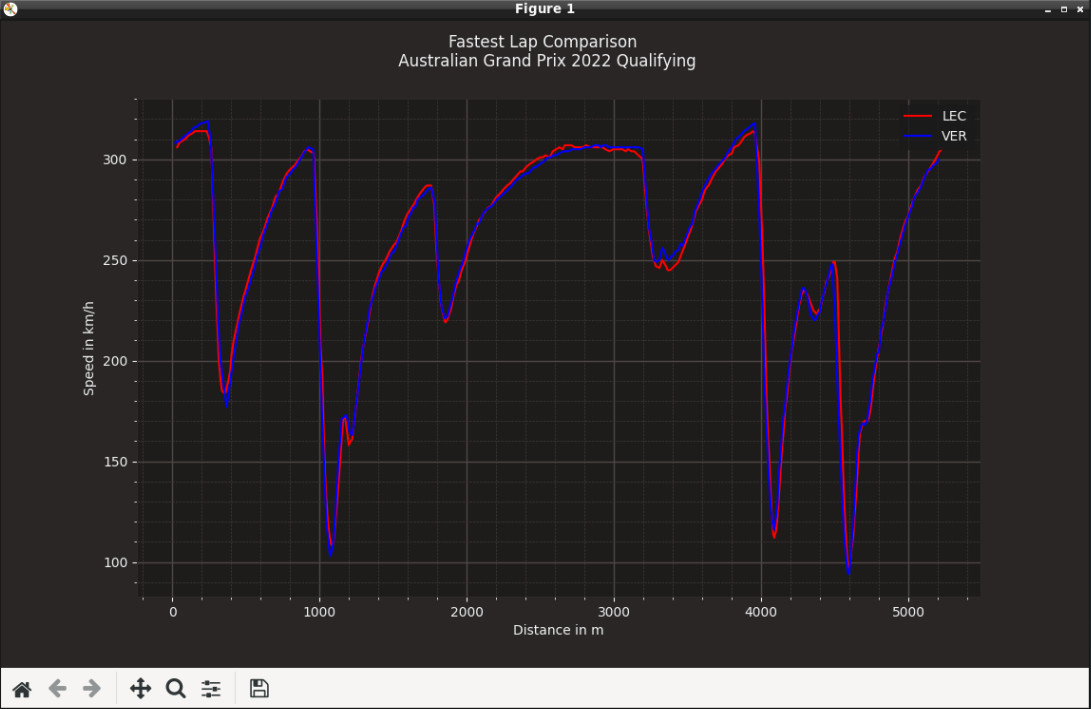
The above picture can be seen at its full resolution from the following link: raspberry-pi-fastf1-ex04-drivers-speed-comparison-output.jpeg.
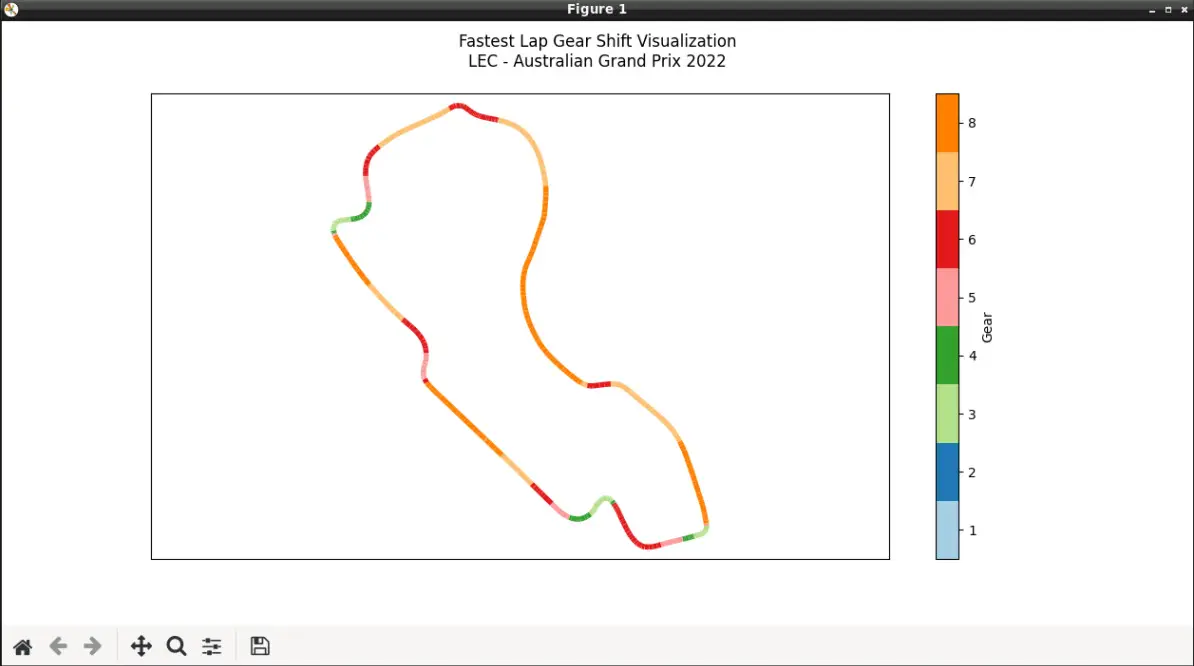
Example 5: Analyze Fastest Lap Gear Shifts
That’s another interactive window coming from FastF1 examples. This script shows the gear changes wi the fastest lap. The following is my customized script:
import fastf1

import matplotlib.pyplot as plt
from matplotlib.collections import LineCollection
from matplotlib import cm
import numpy as np

fastf1.Cache.enable_cache('/home/pi/ff1cache')  # replace with your cache directory

# set session
year=2022
gp=3
ses='Q'

session = fastf1.get_session(year, gp, ses)
session.load()

lap = session.laps.pick_fastest()
tel = lap.get_telemetry()

# Prepare the data for plotting by converting it to the appropriate numpy
# data types
x = np.array(tel['X'].values)
y = np.array(tel['Y'].values)

points = np.array([x, y]).T.reshape(-1, 1, 2)
segments = np.concatenate([points[:-1], points[1:]], axis=1)
gear = tel['nGear'].to_numpy().astype(float)

# Create a line collection. Set a segmented colormap and normalize the plot
# to full integer values of the colormap
cmap = cm.get_cmap('Paired')
lc_comp = LineCollection(segments, norm=plt.Normalize(1, cmap.N+1), cmap=cmap)
lc_comp.set_array(gear)
lc_comp.set_linewidth(4)
plt.gca().add_collection(lc_comp)
plt.axis('equal')
plt.tick_params(labelleft=False, left=False, labelbottom=False, bottom=False)

title = plt.suptitle(
    f"Fastest Lap Gear Shift Visualization\n"
    f"{lap['Driver']} - {session.event['EventName']} {session.event.year}"
)

# Add a colorbar to the plot. Shift the colorbar ticks by +0.5 so that they
# are centered for each color segment.
cbar = plt.colorbar(mappable=lc_comp, label="Gear", boundaries=np.arange(1, 10))
cbar.set_ticks(np.arange(1.5, 9.5))
cbar.set_ticklabels(np.arange(1, 9))

plt.show()
This example is explained by Fast-F1 examples_gallery plot_gear_shifts_on_track page.
The output is the following:
What’s Next
If you want to discover many other projects for your Raspberry PI, you can take a look at peppe8o Raspberry PI computer projects.
Enjoy!

Open source and Raspberry PI lover, writes tutorials for beginners since 2019. He's an ICT expert, with a strong experience in supporting medium to big companies and public administrations to manage their ICT infrastructures. He's supporting the Italian public administration in digital transformation projects.
![]()
![]()
![]()
![]()
![]()
![]()
![]()


I am having a hard time doing basically everything. For start, I installed everything. When I type command “import fastf1”, terminal spits out some errors or something that I am not too sure what it is. I am a beginner in Python, just to clarify that. I ignored those errors, and continued to schedule command. After entering the schedule command, terminal told me that fastf1 is not declared. Could you, please, describe or help me out a bit about what is going on with this? Thanks in advance
Please, can you share the errors coming from the import? Please, can you confirm you used python3 and pip3?
Great job explaining, well done
Thank you!
When I import fastf1 within python I always get the error
“Traceback (most recent call last):
File “”, line 1, in
File “/home/pi/.local/lib/python3.9/site-packages/fastf1/__init__.py”, line 108, in
from fastf1.events import get_session # noqa: F401
File “/home/pi/.local/lib/python3.9/site-packages/fastf1/events.py”, line 181, in
import pandas as pd
File “/home/pi/.local/lib/python3.9/site-packages/pandas/__init__.py”, line 19, in
raise ImportError(
ImportError: Unable to import required dependencies:
numpy: Error importing numpy: you should not try to import numpy from
its source directory; please exit the numpy source tree, and relaunch
your python interpreter from there.
I am not sure how to fix this, I have never used python before so I’m a novice. Thanks
Hi Allen,
I just updated the tutorial as then new Python on Raspberry PI OS requires to install pip packages inside virtual environments. Please try it again and let me know if works. Many thanks