Last Updated on 2nd September 2023 by peppe8o
This tutorial will show you how to use a Pulse Sensor with Raspberry PI Pico and MicroPython.
Checking heartbeats has more applications than one could think. For example, it is a required feature in projects involving sports IoT devices. The Pulse Sensor with Raspberry PI Pico gives a cheap way to perform this task.
Before starting, let me admit that this has been one of my most complex projects. It’s not just for the code itself or wiring, as the Pulse Sensor can give different results both during the time and at different sensor pressure levels. So, in this tutorial, I’ve tried to describe the rationals that bring me to my thresholds, so that you can adjust them based on your sensor production and use cases.
How the Pulse Sensor Works

It is really interesting to know how this fantastic device detects heartbeats.
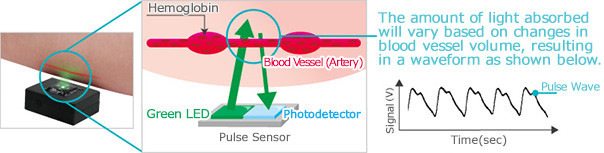
Basically, the Pulse Sensor is composed of a LED and a Photodetector. The photodetector returns to the microcontroller the analog value of the reflected light returning from objects near the LED.
With a finger put in front of the LED, the light reflection varies based on the haemoglobin flowing in your veins. The more haemoglobin is passing, the more light is reflected.
When the heart pumps the blood, it results in a sort of boost of haemoglobin quantity that influenced the returned light and creates a signal wave.
A good explanation picture can be found at rohm.com website:
You may think that this is so simple to read and easy to implement. Quite correct, but the very hard work – at least with my Pulse Sensor model, has been that when no finger is present I get random results that made it impossible to distinguish if I was measuring anything or not. The following chapters will show you how I approached this problem.
Pulse Sensor Pinout
The Pulse Sensor module has only 3 PINS:
| PIN | Usage |
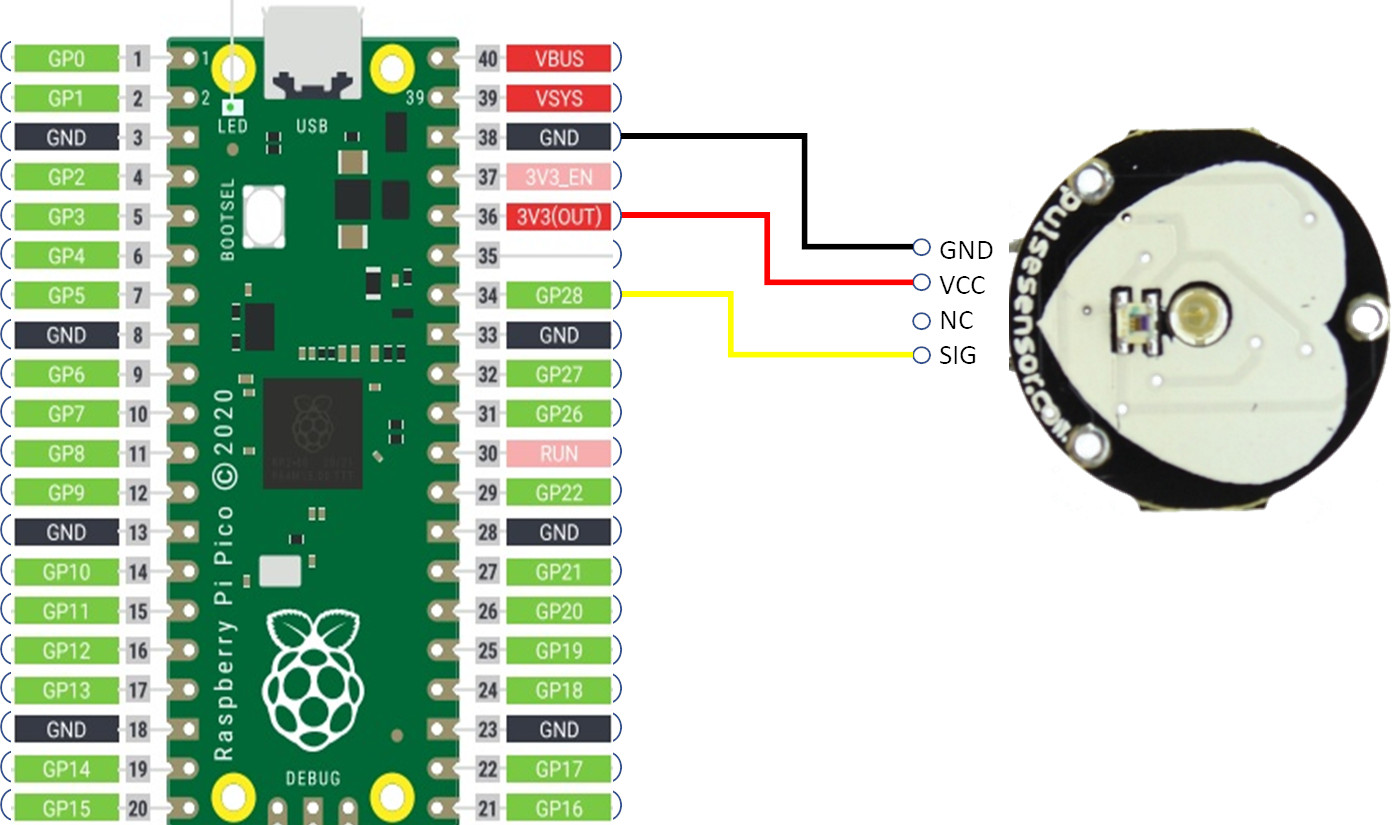
| GND | Used to connect the Ground Pin on Microcontroller |
| VCC | Used to power the Pulse Sensor. It can be connected with the 3,3V PIN |
| SIG | Connect this with your microcontroller Analog input |
Some Pulse Sensor modules also include a 4th PIN. This is usually required with standard connectors (especially for those devices produced to be used with a connector shield). Still, usually, the additional connector has an “NC” label which means that it doesn’t have to be connected.
What We Need
As usual, I suggest adding from now to your favourite e-commerce shopping cart all the needed hardware, so that at the end you will be able to evaluate overall costs and decide if to continue with the project or remove them from the shopping cart. So, hardware will be only:
- A common computer (maybe with Windows, Linux or Mac). It can also be a Raspberry PI Computer board
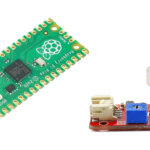
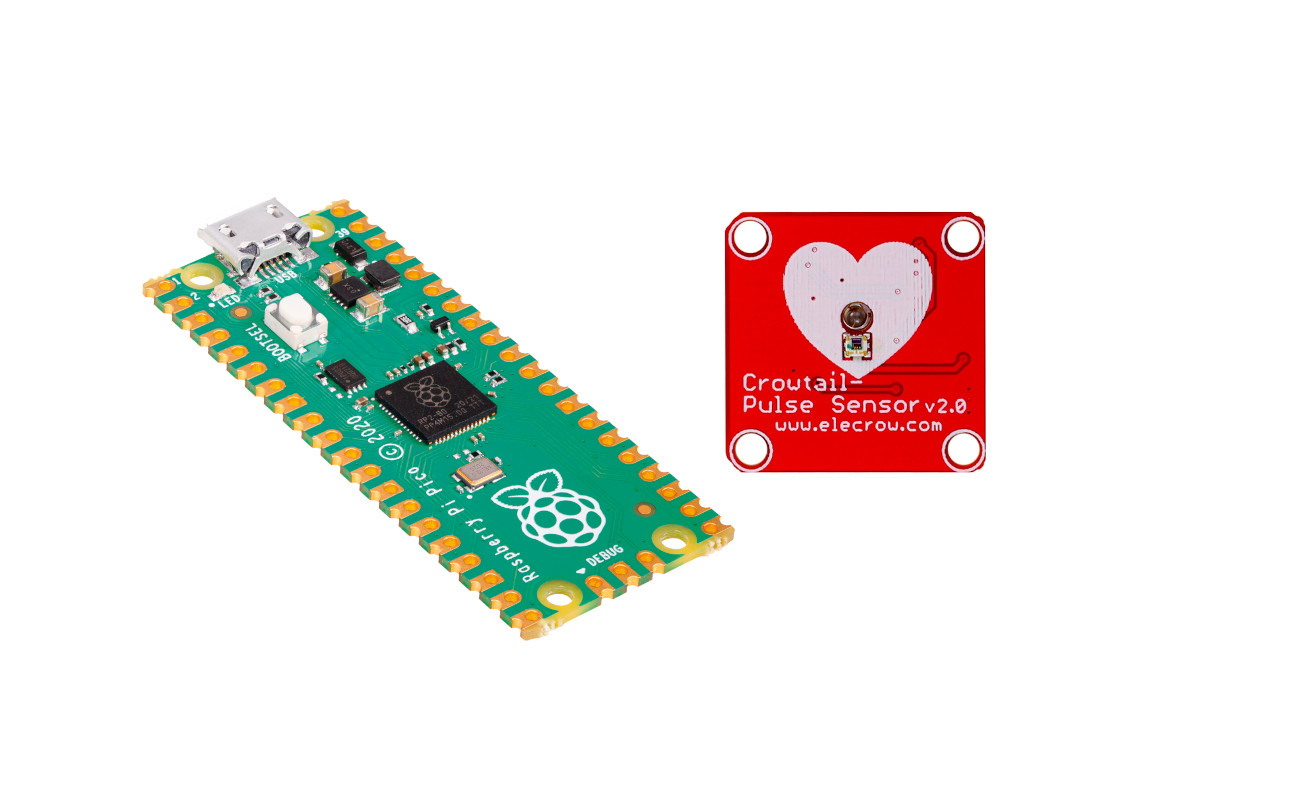
- Raspberry PI Pico microcontroller (with a common micro USB cable)
- Pulse Sensor (I used the following from Elecrow)
- breadboard
- dupont wirings
The Pulse Sensor that I’m going to show in my lab pictures comes from my CrowPI2 bundle.
Check hardware prices with the following links:


Step-by-Step Procedure
Pulse Sensor and Raspberry PI Pico Wiring Diagram
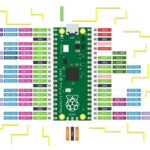
Please arrange the wiring as in the following picture, according to Raspberry PI Pico pinout:
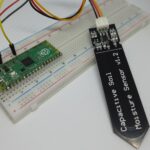
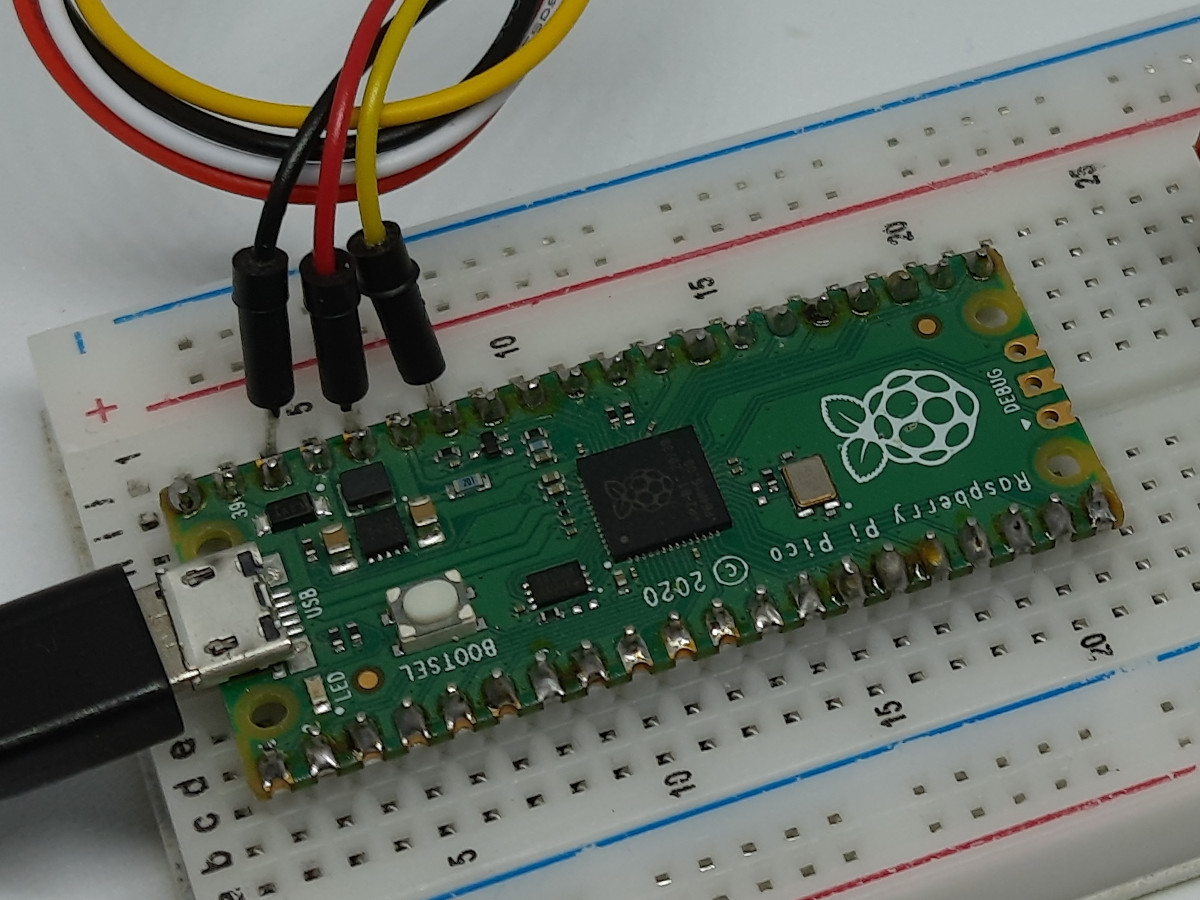
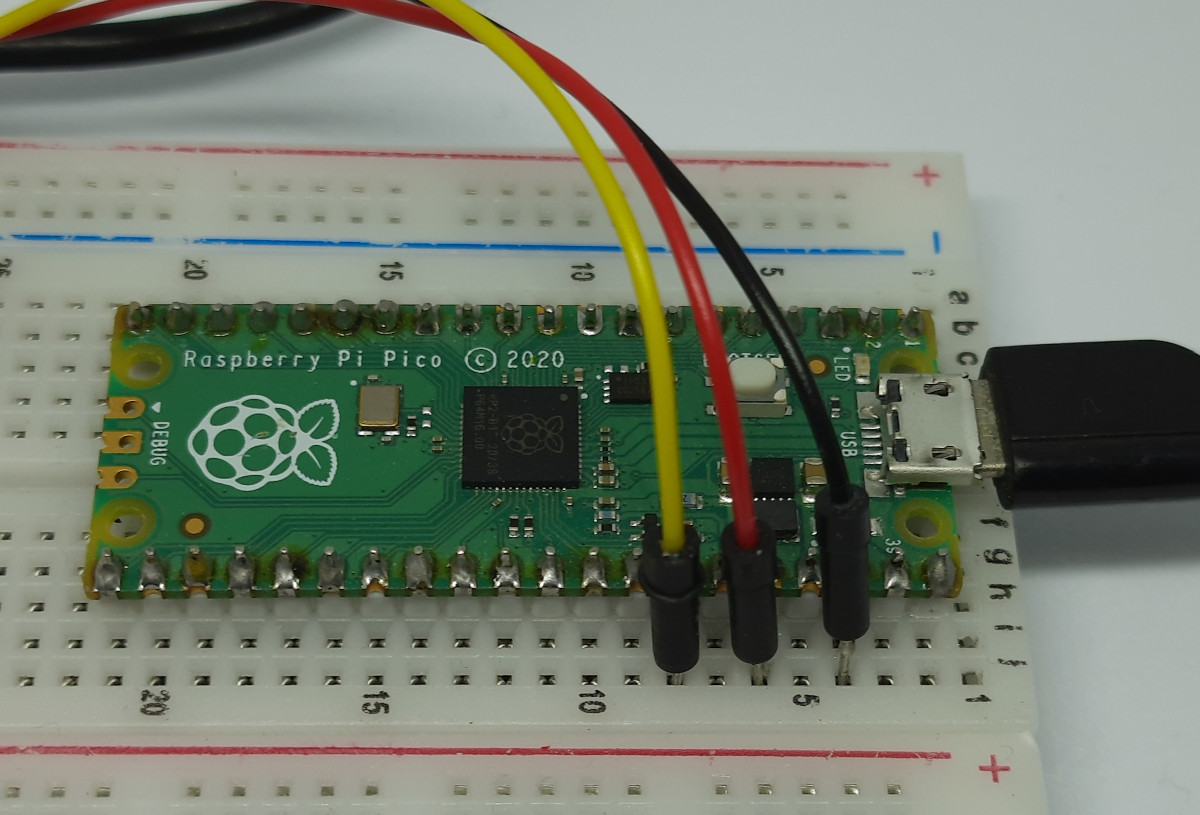
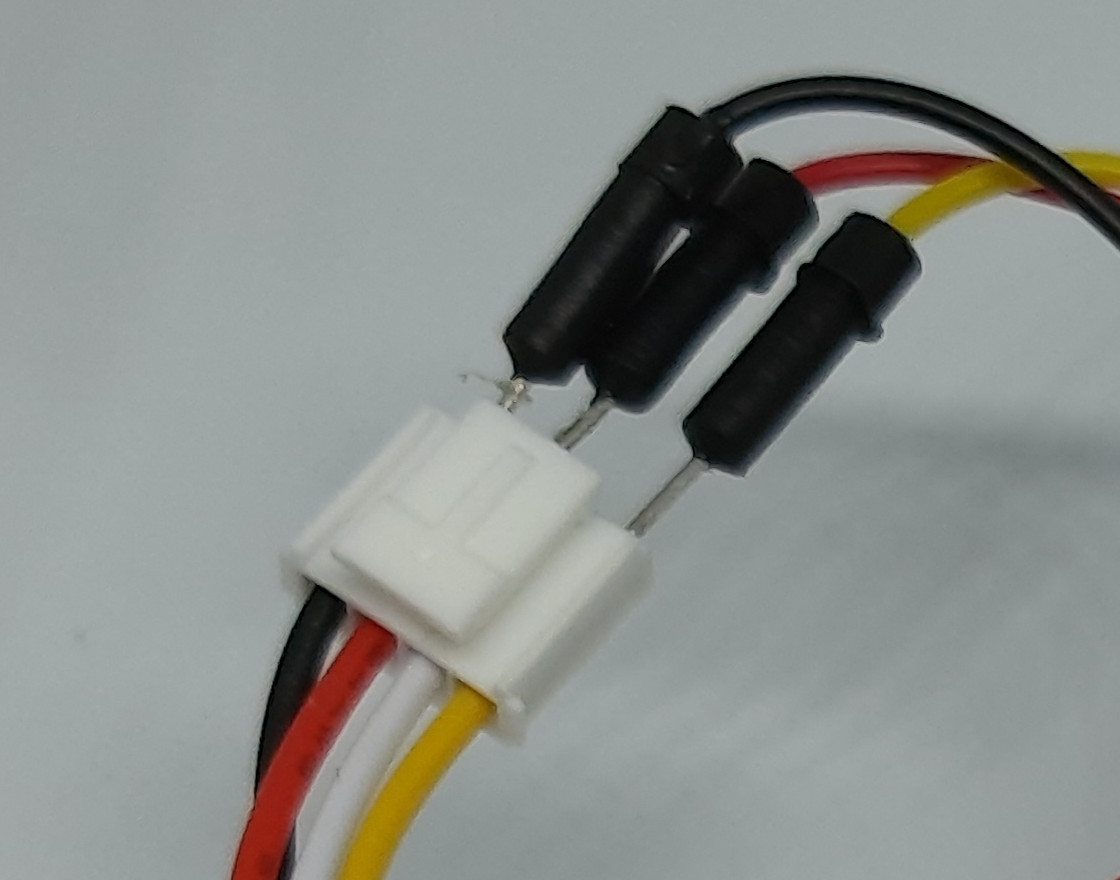
Please find below some pictures from my lab:
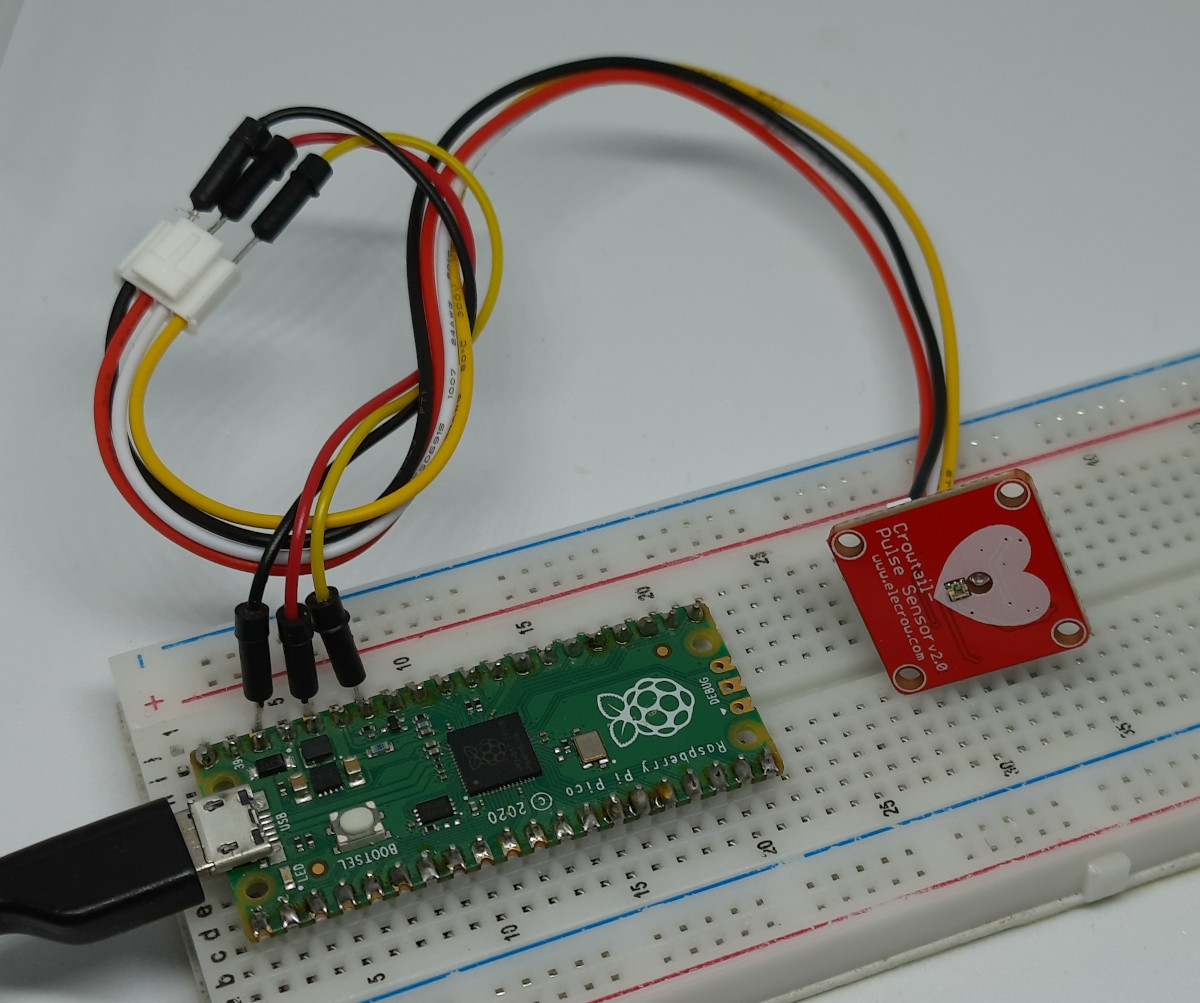
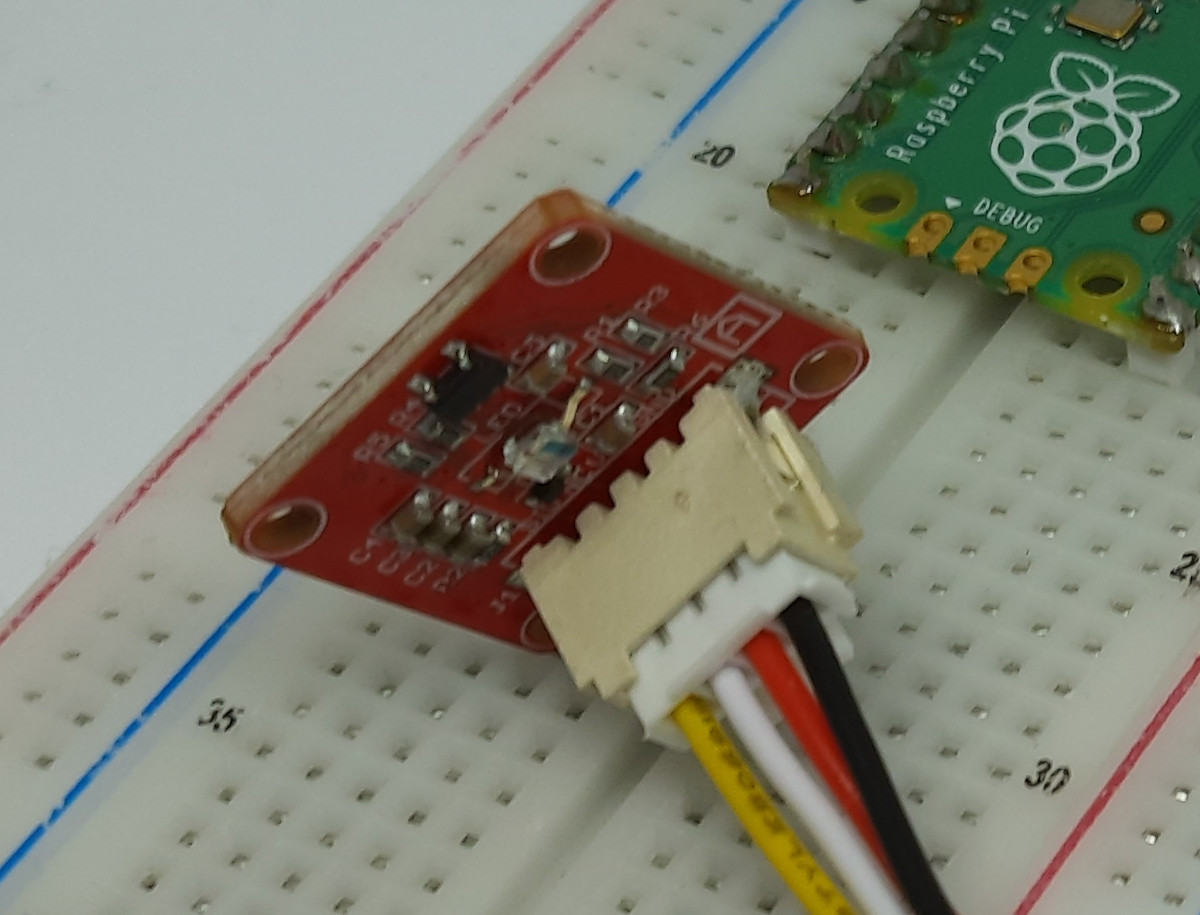
As my connector includes 4 wires, I’ll leave the white one not connected because it is the “NC” connector:
Step-by-Step Procedure
Connect RPI Pico to Thonny (you can refer to my tutorial about the First steps with Raspberry PI Pico).
We’ll go through an initial step of analyzing the raw data produced by the Pulse Sensor, then finding the proper algorithm that can assure a reliable heart beat trigger. For this analysis purpose, I’ve used the following MS Excel sheet that you can also get with the following link:
In the excel file, you can just overwrite the first 2 columns (“Empty” and “Pressed”) with the results from the following raw data collection.
Collecting Raw Data from Pulse Sensor
IMPORTANT NOTE: please consider that the Pulse Sensor results are strongly affected by the way you put the finger on the sensor. Pressing too much it will result in your blood not flowing freely in the finger, while keeping it too much released may incur in less light reflections. Even in this you will need a bit of tests and a good idea for the sensor usage in your projects will be finding a way to keep it at the right pressure (some people use a strip for this).
For this purpose, we’ll use the following MicroPython script:
Get it and upload to your Raspberry PI Pico storage.
The code is really simple. At the begin, we import the required modules:
from machine import ADCThe we set the analog pin to read. This is the PIN where the Pulse Sensor signal is attached:
pulse=ADC(28)This script will create a file, in the Raspberry PI Pico storage, that will collect all the values read at the analog port and name it as “PressedTest.txt”. For this purpose, we create a file object with write permissions:
file = open("PressedTest.txt", "w")We also initialize a counter named “x”. This will make the script collecting 10.000 samples in the following while loop:
x=0The main while loop will run until the counter will reach 10.000 runs (that means getting 10.000 samples). At the start we use the x=x+1 in order to increase the counter at each run:
while x<10000:
    x=x+1
The “try” statement will read the analog input value at each run and write the value in our file. Please note that the “\n” appended at the end of the file.write() will set a carriage return, so that each value will take a line and the result can be just copied from the txt file and pasted in the related MS Excel column. A final except statement will manage every error by resetting the Raspberry PI Pico and restarting the process:
    try:
        value=pulse.read_u16()
        file.write(str(value)+"\n")

    except OSError as e:
        machine.reset()
At this point, please put your finger on the Pulse Sensor and run the script keeping the finger on it for all the time. The test will take about 10 seconds.
At the end the file will be generated in your Raspberry PI Pico storage. You will be able to see it from the Thonny file explorer (you can enable it from the View menu -> Files. If you don’t see it, try by using the “Stop” button on Thonny in order to force the program to re-load the Raspberry PI Pico storage content.
Now, you can edit the script by changing the following line:
file = open("PressedTest.txt", "w")with:
file = open("EmptyTest.txt", "w")In a few words, we’ve changed the file name for the second test results.
Take care to leave the Pulse Sensor free from any finger and run again the test. the new “EmptyTest.txt” file will appear.
Analyzing the Raw Data
Now, please download the two txt files in your computer and open the “pulse-sensor-analisys.xlsx” MS Excel file. Copy the content from EmptyTest.txt to the “A” column (named “Empty”) on Excel and the content from PressedTest.txt to the “B” column (named “Pressed”) on Excel. During the paste phase, please leave the first row as is.
The charts already prepared on my MS Excel file, as well as the following 3 columns, should update automatically.
The first chart shows the raw data imported:
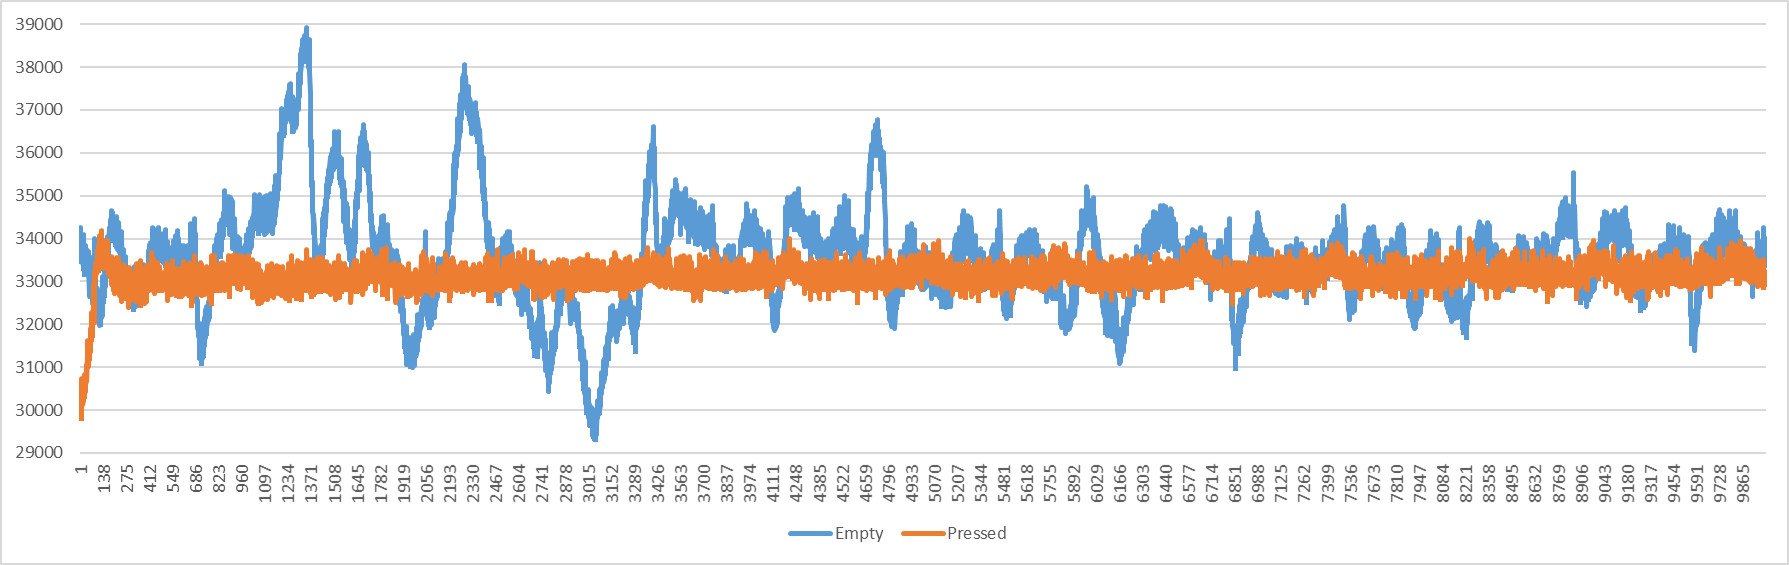
It doesn’t tell us a lot of information, besides the fact that when the sensor is left empty the resulting data have a big variability with higher max values and lower min values, compared to the “pressed” test. We’ll use this in order to detect if a finger is present or not. There is also a spike at the beginning of the test that can be skipped in our analysis.
The following chart:
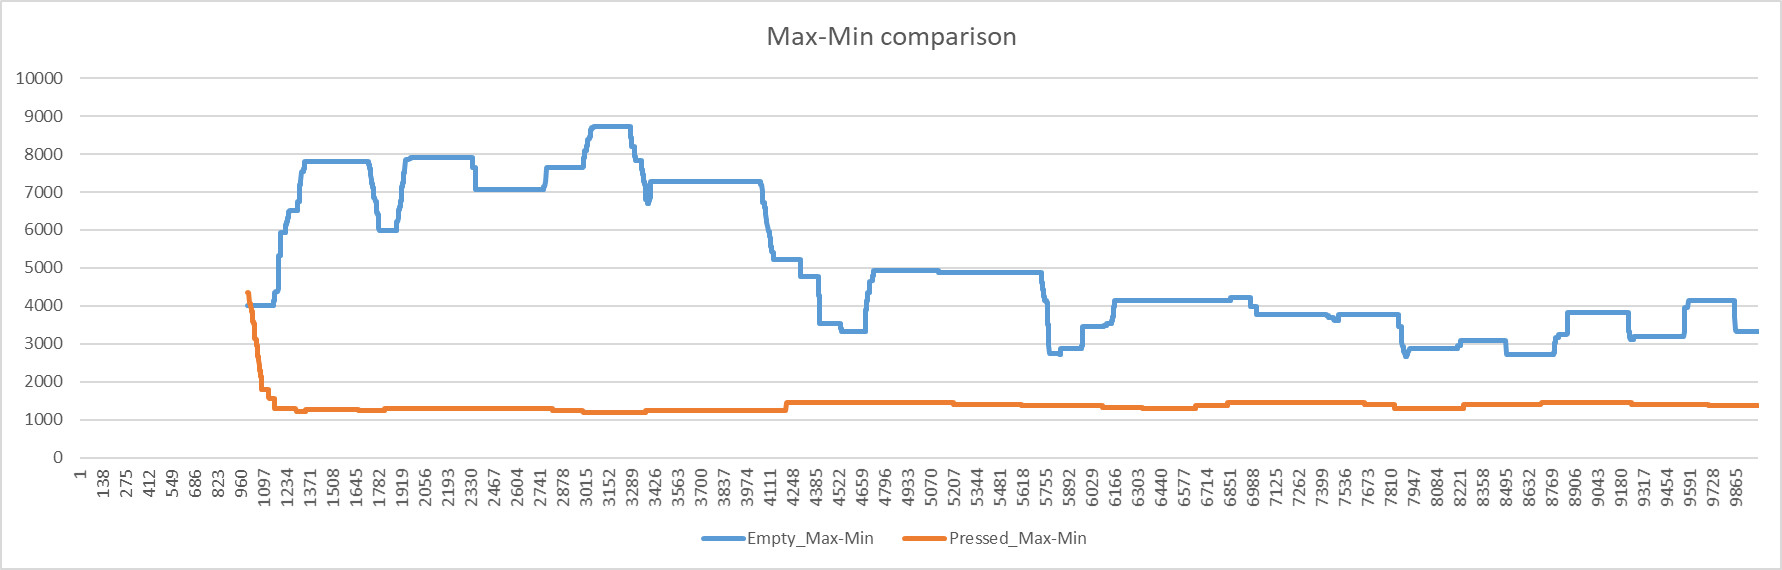
Implements this theory and shows that calculating the Max values (on the last 1.000 samples) – Min values will give us a clear threshold to detect if the finger is present. From this chart, I’ve stated that when this calculation is lower than 2.000 I can run the actions foreseen for the “finger detected” state. On the other hand, when this calculation is higher than 2.000, I’m getting only the environment noise and I can assume that nothing is present. Still, you can skip the initial spike as transient effect.
To detect the heart beat, we need to analyze the last chart:
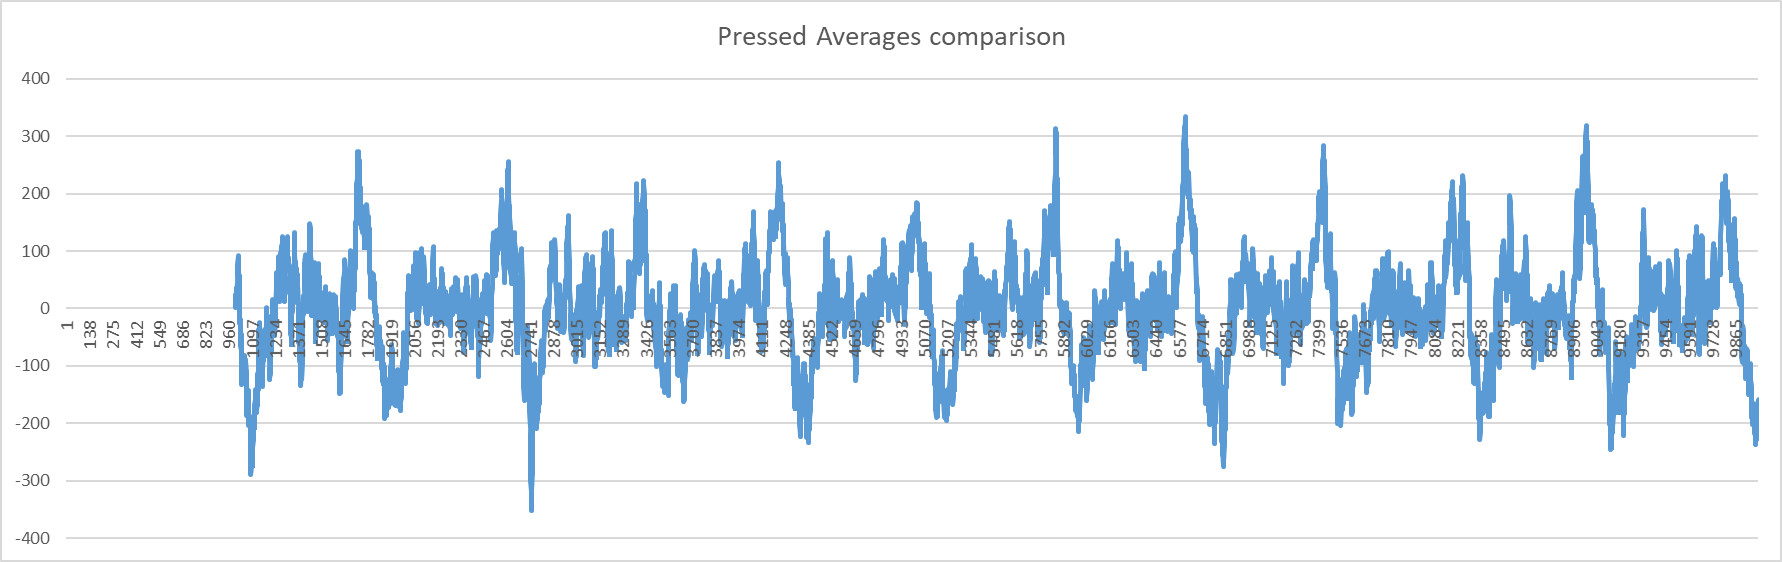
Here I’ve traced what the traders call “moving averages”. I’m calculating the average of the last 15 samples minus the average of the last 100 samples. Here you can see the spokes created by the heart beats and, with my results, that having a threshold when this value overcomes the “200” value can give us a good way to detect a beat. Now, we have to build it in MicroPython code.
Get the pulsesensor-pico.py MicroPython Code
Finally, we get to the MicroPython code to run our Pulse Sensor with Raspberry PI Pico. Please get it from the following link:
Before running it, I’ll explain the lines.
As usual, we’ll start importing the required modules:
from machine import ADC, Pin
This time, I’ve also included the “Pin” module as I’m going to blink the on-board LED at every heart beat, so returning a visible result.
We’ll configure the 2 used PINs: the analog input and the LED output:
pulse=ADC(28)
led = Pin(25, Pin.OUT)
Please note that with the new Raspberry PI Pico W firmware, the on-board LED may require to change the second line with this -> led = Pin(“LED”, Pin.OUT).
Now, a few variable assignments follow.
The max_samples variable will make our in-memory history no longer than 1.000 samples.
The short_average variable will configure the short moving average to 15 samples.
The long_average variable will configure the short moving average to 100 samples.
The beat_threshold variable will set to 200 the threshold for heart beat detection.
The finger_threshold variable will set to 2.000 the threshold for finger presence detection.
Finally, the history initializes an array that will store the samples managed to create the calculations according to what analyzed with raw data. having all the variables in this place will make simpler to fine tune them according to your device and conditions:
max_samples = 1000
short_average=15
long_average=100
beat_threshold=200
finger_threshold=2000
history = []
A custom function will keep all the actions that you will need to execute in this state. Here, we calculate the two averages (15-samples and 100-samples according to my analysis) and compare their difference with the threshold. In my case, when I get a beat I will power the LED on, but you can change it easily with your custom actions. For example, you could calculate here the BPM.
def finger_detected():
    avg_1=sum(history[-short_average:])/short_average
    avg_2=sum(history[-long_average:])/long_average
    if avg_1-avg_2 > beat_threshold:
        led.value(1)
    else:
        led.value(0)
The main loop will become easy to understand. At each loop, we read the analog input and append it to the history array:
while True:
    try:
        value=pulse.read_u16()
        history.append(value)
The following line will keep the history array always not longer that the defined max samples:
history = history[-max_samples:]Then, if the difference between the history max value and min value is lower that the finger_threshold, the the actions foreseen will be run by calling the finger_detected() custom function. Otherwise, the led is switched off (you can also create a custom function for “finger_not_detected”):
        if max(history)-min(history) < finger_threshold:
            finger_detected()
        else:
            led.value(0)
Finally, an except statement will restart the Raspberry PI Pico on errors detection:
    except OSError as e:
        machine.reset()
Test the Pulse Sensor with Raspberry PI Pico
Now, you can run the script. From your Thonny, please execute it by pressing the F5 key (or the Run button).
Put your finger on Pulse Sensor and wait a few seconds in order to get the samples enough stable to give a reliable result (usually around 5 seconds). This will be also useful to try changing the finger position and pressure level giving you the best results.
The on-board led will start to give you a visual feedback on heart beats.
Please remember to rename the “pulsesensor-pico.py” to “main.py” if you want this script to run automatically on Raspberry PI Pico even without a PC plugged.
What’s Next
Interested to do more with your Raspberry PI Pico? Try to look at my Raspberry PI Pico tutorials for useful and funny projects!
Enjoy!
Open source and Raspberry PI lover, writes tutorials for beginners since 2019. He's an ICT expert, with a strong experience in supporting medium to big companies and public administrations to manage their ICT infrastructures. He's supporting the Italian public administration in digital transformation projects.
![]()
![]()
![]()
![]()
![]()
![]()
![]()